JSNA Live Well - Healthy lifestyle and behaviours
1. Health Behaviours and Lifestyle
This JSNA Chapter presents data around healthy eating, good nutrition, physical activity and those groups in the Borough which need targeted support. Please note further information and more detail around these topics can be found elsewhere in the relevant sections of the JSNA.
1.1 Introduction to Health Behaviour
Human behaviour and lifestyle factors can affect every aspect of health and wellbeing both favourably or unfavourably and to a different degree throughout an individuals’ life. Lifestyles and health behaviours are complex and influenced by multiple factors including genetics, wider determinants of health, previous experiences throughout life, the environment, societal factors, cultural factors as well as individual and interpersonal factors. Therefore, the misconception that individual’s behaviour is due to ‘choice’ alone, over-simplifies our understanding.
When considering health behaviours and lifestyle, it is helpful to think of health and wellbeing on a dynamic continuum over the life course. While the degree of influence and need for intervention will vary based on individual circumstances and need, the fundamental components of a healthy lifestyle are relevant to all individuals, irrespective of health and wellbeing status and can favourably influence health and wellbeing at all life stages. Therefore, the potential benefit of healthy lifestyle behaviour change should not be under-estimated.
National evidence suggests that a quarter of England’s adult (age 16+) population engage in three or more behavioural risk factors 1. The Wandsworth Joint Strategic Needs Assessment 2017/18 and Annual Report of the Director of Public Health 2017/18 2, highlighted a number of Wandsworth residents engage at least one behaviour that can have a detrimental impact on their health.
Based on most recent data, 7.8% of adults in Wandsworth are smokers 3, 1.5% of adults in Wandsworth are estimated to be dependent on alcohol 4 and 15.8% of people in Wandsworth are physically inactive, completing less than 30 minutes of physical activity per week.
Though we are unable to ascertain how many residents engage in multiple behavioural risk factors based on local data, current evidence suggests these behaviours tend to cluster together, creating multiple risk factors for poor health 5. Based on national estimates and the current population in Wandsworth (aged 15+), it would be expected that around 76,700 residents engage in three or more behavioural risk factors. The health of people of Wandsworth is generally faring better than the rest of England.
These behaviours are all modifiable have the potential to improve multiple areas of health and wellbeing for the residents of Wandsworth such as reducing the impact of and preventing long term conditions, improving mental health and wellbeing of residents and encouraging social connectedness of residents in the borough. Whilst there is good work happening across the borough and evidence of good practice, numerous residents are engaging in behaviours that are detrimental to health in both the short and long term or exposed to environmental and metabolic risks for poor health. This chapter considers the contribution of lifestyle and health behaviour on the health and wellbeing of the residents of Wandsworth based on current evidence and local data.
Life expectancy at birth for men and women of Wandsworth is 80.6 and 84.2 respectively, higher than national figures. Healthy life expectancy at birth for residents is also higher than the national figures for both men, at 62.7 years, and women, at 68.1 years. However, there are areas for improvement.
The impact of the COVID-19 pandemic on the lifestyles, health behaviours and health and wellbeing of local residents remains unclear. However, the need for supporting residents in improving physical and mental health, in part with promoting and facilitating healthy behaviours is a priority in light of the tragic COVID-19 pandemic.
Health Behaviour Across the Life Course
Making healthy lifestyle changes has the potential to reduce risk of developing long-term conditions, improve health and wellbeing and also improve health and ability to function independently in later life. Evidence suggests that behaviour change is both easier to achieve, more cost-effective, gives a greater return on investment and is more likely to be long-standing if established early in life 6.
Throughout the life course, from preconception to end of life care, all individuals are vulnerable to the risks posed by health-harming behaviours and environments. Children and elderly people are at increased risk from poor health behaviours and therefore are more vulnerable to risk factors that contribute to poor health and wellbeing and ultimately chronic conditions.
Within the first two years of life, a child’s absorbs new information and learns from and adapts to its surroundings. This process is influenced by diet, relationships, stress, socio-economic status and physical activity – all of which form the foundations for a child’s cognitive development and affects not only their health and wellbeing, but all areas of learning including social and intellectual development. Parents, families and caregivers are, of course, crucial for shaping childhood behaviour and healthy, or unhealthy, behaviour. Behaviour in childhood lays the foundation for behaviour in adulthood, for example, those who are physically active in childhood are much more likely to be physically active as adults.
This is relevant to residents in Wandsworth. The latest available data comes from the Active Lives Children and Young People Survey, Sport England; in 2020/21 the proportion of physically active children and young people was 63.0%, in comparison with the London average of 44.4% and the national average of 44.6 % 7. Based on evidence that physical activity declines with age, this behaviour is likely to decline into adulthood and can lead to intergenerational behaviours of physical inactivity passing through families.
In Wandsworth 17.4% (n=57,783) of the total population are under 18 in 2023, with a third of all households containing children. The population of 0–17-year-olds is projected to decrease by 9.6% by 2041 (from 57,783 in 2021 to 52,257 in 2041) 8. The population aged 10-24 years experiences a range of changes in lifestyle with associated behavioural, emotional and social changes; it is at this age in which life-long health behaviours tend to become set in place, which provides a unique opportunity to intervene and promote healthy behaviour within this age range with the view to impact positively on health outcomes later on.
Typically, behaviour change at this stage is influenced by peers rather than the family unit. Intervention in this age group is key in preventing chronic disease later in life as most health harming behaviours become habituated in adolescents and early adulthood. It is currently unclear from the above data how many adults locally are exposed to multiple risk factors, however these risk factors typically cluster and risk accumulates with additional risk factors.
Taking a life course approach to health behaviour, the WAY survey from 2015 showed that Wandsworth ranked 9th highest of all London Boroughs for 15-year-olds reporting three or more risky behaviours at 12.1% including smoking, alcohol use, drug use, physical inactivity. This was worse than the London average of 10.1% but lower than the England average of 15.9% 9.
Older adults and children are at an increased risk of the detrimental health impacts of poor health behavior. In Wandsworth, 9.8% of residents are aged over 65 years 10. There is predicted to be a 25% rise in 60-79-year-olds (from 33,986 in 2019 to 42,624 in 2029) and a 37% rise in 80+ year olds by 2029 (from 8,419 in 2019 to 11,511 in 2029), with the highest proportions of residents aged 80 and over in wards of St. Mary’s Park, East Putney, West Putney, Nightingale and Thamesfield12. In 2011 census, the largest number of those aged 65+ living alone was in West Putney (7.6%, n=785), Roehampton and Putney Heath (7.4%, n=770) and East Putney (7.1%, n=737).
Along with Age UK, The Office for National Statistics (ONS) has produced estimates of subjective loneliness for people aged 65 and over. Wandsworth ranks 13th highest of out 33 in London and 63rd highest out of 326 in England 11.
Towards the more severe end of poor health, we have long-term conditions. Long term conditions are associated with modifiable behaviours and develop over a prolonged period of time, offering preventative services time needed to arrange opportunities for intervention.
A place-based, community approach to design services to promote positive health behaviours in these areas, could reduce the risk of future ill-health, improve management of current long-term conditions, improve mental wellbeing and promote independence later in life, potentially increasing social connectivity.
1.2 Lifestyle Risk Factors for Long-term Conditions
Unhealthy behaviours tend to cluster together creating multiple risk factors for poor health both in individuals and communities. Chronic diseases are the leading causes of death and disability worldwide and the WHO acknowledges that rates of these conditions are accelerating globally and account for around 71% of deaths globally. The WHO states the 5 main risks for developing non-communicable disease risks are as follows, all of which involve modifiable human behaviours:
Unhealthy diet: high in salt, sugar or unhealthy fats
Tobacco use
Air pollution
Harmful use of alcohol
Physical inactivity
Cardiovascular disease, cancer, respiratory diseases and diabetes account for most of deaths globally, with the local information on each of these long-term conditions has been explored in separate sections of the JSNA. These longterm conditions are of course also the result of a combination of genetic, physiological, social and environmental factors alongside the modifiable individual behaviours. However, each of the conditions listed can, to some degree, be prevented, outcomes improved and in some cases disease processes reversed with changes in lifestyle behaviour.
These lifestyle behaviours can be introduced at an individual, community and societal level. Wandsworth health data may fare relatively well when compared to national data for certain lifestyle behaviours, however, this can be falsely reassuring when considering the multiple detrimental impacts of physical inactivity, poor diet or substance misuse can have on all aspects of health and wellbeing both the short and longer term.
The relationship between risk factors and burden of disease is complex given the nature of the risks and interaction between behavioural, environmental, metabolic factors risk factor exposure. Depending on the disease considered, the degree of attributable risk varies, however, on the whole, the main risk factors accounting for the total burden of disease in England, according to PHE,14 15can be categorised into the following groups:
Behavioural Risks
Behavioural risks according to the Global Burden of Disease Study (2013) 12, 13.
- Tobacco use
- Alcohol consumption
- Drugs usage
- Diet low in fruits, vegetables or whole grains
- Physical inactivity
Prevalence and need locally:
Tobacco: Smoking prevalence for adults in Wandsworth is significantly lower than the London and England averages. In Wandsworth, there has been a substantial decrease in prevalence of smoking in adults between 2012 and 2022 (15.1% to 7.8%) comparative to London (18.2% to 11.7%) and England (19.3% to 12.7%) 14.
Alcohol: Between In 2014/15, 1.5% of Wandsworth residents are estimated to be dependent on alcohol - the 12th highest proportion in London 15.
Drugs: South West London had the highest proportion (11.7%) of drug use amongst all London regions as of 2018/1920. Further information can be found in the Wandsworth Substance Misuse Strategy 2020-2024.
Diet low in fruits, vegetables or whole grains: Based on the results from the Active Lives Survey, the proportion of the local population aged 16 and over who, when surveyed, reported that they had eaten the recommended 5 portions of fruit and vegetables on a usual day was 63.9% an increase from 57.8% in 2018/19 and significantly better than London (55.8%) and England (55.4%).
Physical inactivity: 15.8% of adults were reported to be physically inactive, completing less than 30 minutes of physical activity per week in 2021/22. While this is a lower proportion of the local population who are physically inactive than the London (22.9%) and England (22.3%) averages, the percentage of adults who are physically inactive locally has slightly increased from 15.7% in 2018/19.
Metabolic Risk Factors
Metabolic risks according to the Global Burden of Disease Study (2013) 16, 17
High body mass index
High systolic blood pressure
High plasma fasting glucose
Level of Need Locally:
High BMI: As of 2021/22 around half of adults aged 18+ (50.8%) in Wandsworth are still classified as overweight or obese, a small reduction from 52.9% in 2015/16. Whilst locally, obesity rates are lower than in London (55.9%) and England (63.8%), this data can seem falsely reassuring given that still half of the adult population in Wandsworth are at significant risk of morbidity and mortality associated with overweight and obesity 18.
High systolic blood pressure: In Wandsworth QOF data from 2021/22 recorded that 8.3% of patients on practice disease registers had a diagnosis of hypertension, which was a lower percentage of total patients than in London (11% - latest published figure for 2019/20) and England (14%) 19. However, Wandsworth identifies only 67% of the patients with hypertension, which is the 9th lowest proportion of diagnosed hypertension among London boroughs 20.
High plasma fasting glucose: 15,670 residents in Wandsworth were recorded as diabetic on practice disease registers in 2021/22, which was significantly lower than the London and England averages. However, the estimated diabetes diagnosis rate in 2018 was 60.9% which was lower compared to London (81.4% and England (78.0%). In 2015 the estimated prevalence of non-diabetic hyperglycaemia based on the characteristics of the local population in Wandsworth estimated a further 23,500 residents had non-diabetic hyperglycaemia, a metabolic risk factor 21.
Air Pollution
Around half of London’s air pollution is caused by road transport 22, toxic fumes from vehicles cause thousands of premature deaths every year and lead to young Londoners growing up with respiratory complications such as reduced lung volume and asthma. Key pollutants include NOx, PM10, PM2.5 and CO2. The largest sources of pollution locally were road transport, construction, and industrial and domestic health and power.
Wandsworth is home to seven Air Quality Network pollution analysers: Battersea, Lavender Hill, Putney, Putney High Street, Putney High Street Façade, Tooting High Street and Wandsworth Town Hall. In Wandsworth, between 2010 and 2016, The London Atmospheric Emissions Inventory estimated emissions of these key pollutants by source type. In their 2016 report they found that there were 800, 900 people in Wandsworth exposed to an annual average NO2 concentration that is above the Air Quality Strategy objective of 40µg/m3, based on the modelled 2016 ground level concentrations. This makes up 26% of the population, which is lower than inner London (48%) but much higher than outer London (3%) and higher than Greater London (24%). 23
Locally 6.6% of mortality in those aged 30+ from all causes can be attributed to air pollution. This is higher than the England average (5.5%) but similar to London (6.5%). Since 2010, the borough has seen a decrease in emission of CO2, NOx and other pollutants. The proportion of mortality in those aged 30+ from all causes that can be attributed to air pollination has fallen from 7.3% in 2010 to 6.6% in 2021.
More on air pollution can be found in JSNA Place chapter.
Trends in Risk Factor Exposure
Generally, over the last decade there are some notable trends in risk factor exposure in England 24:
- Declines in air pollution, smoking, cholesterol and hypertension
- Increases in exposure to low physical activity, high BMI and drug
use
- Little change in dietary exposures
In summary, in Wandsworth data suggests there has been:
- A decline in exposure to air pollution since 2010.
- There has been an increase in physical inactivity in adults locally, based on pre-COVID-19 data.
- Minimal changes have occurred in the proportion adults aged 18+ classed as overweight or obese or adults aged 18+ who are currently smoking.
- A large number of the residents are exposed to metabolic risks with around half of the adult population being classified as overweight or obese, 7.1% of residents are expected to have diabetes and 8.3% residents on practice lists with a diagnosis of hypertension.
- Inequalities exist in fruit and vegetable consumption between different groups in the borough.
It is currently unclear how many residents have multiple risk factors based on local data, however, based on national evidence, it would be expected that around 76,700 residents aged 15+ in Wandsworth are engaging in three or more behavioural risk factors. Therefore, a number of Wandsworth residents remain at risk from behavioural, metabolic and environmental risks associated poorer physical and mental health and wellbeing and subsequently, in the longer-term, chronic disease.
Addressing these risk factors and tackling health harming behaviours and their drivers in the borough will improve the health and wellbeing of residents, given we are aware of the cumulative nature of the above risks and the knowledge these risk factors tend to cluster.
1.3 Inequalities in Health Behaviours
Health conditions are poorer in the top quintile of the most deprived areas in Wandsworth. 5.7% of people living in the most deprived areas of Wandsworth have bad or very bad health compared to 3.3% in all other areas of Wandsworth. In addition, 50% living in the most deprived areas consider themselves to have very good health. This is lower than the remaining population in Wandsworth (59.3%).
Often, clustering of behaviours detrimental to health is associated with social factors such as socio-economic status including educational attainment thus creating multiple risk factors for poor health. Individuals living in more deprived circumstances are more likely to be exposed to multiple risk factors, further influencing health behaviour and lifestyles which act to further widen social inequalities in health.
In 2019, the borough of Wandsworth ranked 173rd most deprived out of 317 local authorities across England: placing it within the 50% least deprived local authorities in England. The Annual Survey of Hours and Earnings (ASHE) estimates that Wandsworth residents working full-time earned £43,470 in 2019. This is amongst the top three annual earnings in London and England 35. However, there are income inequalities within the borough, that is how unequally income is distributed within the population; Wandsworth’s income inequality is the 6th highest in London 25
Overall in 2018, there were 68,853 people living in the most deprived areas of Wandsworth. These are small areas that fall into the top 20% of deprivation compared to the rest of Wandsworth. Of these people 13,903 are children and 8,874 are adults over 60.
There are in total, 27,822 people from ethnic and minority backgrounds living in the top 20% most deprived areas of Wandsworth. This makes up the largest proportion of people from ethnic and minority backgrounds compared to the other deprivation quintiles. This quintile has the lowest proportion of white ethnic groups (36,105), compared to the other quintiles for deprivation 26 27
The London Poverty Profile (2021) ranks London boroughs on key poverty and inequality indicators. In Wandsworth 11% of employed residents earn less than the London Living Wage - the joint lowest percentage in London, the poverty rate, that is the number of people that’s income falls below the poverty line is 22% of the population, this is below the London average (27%).
The average Income Deprivation Affecting Children Index (IDACI) score for the borough indicates that 15% of children (0-15) are affected by income deprivation (2019), compared to 21% in 2015. Despite this and a relatively less deprived rank (150/317) compared to 2015 (123/326), Wandsworth remains within the 50% most deprived children local authorities nationally.
The average Income Deprivation Affecting Older People Index (IDAOPI) score indicates that 21% of older people (60+) are affected by income deprivation in Wandsworth, compared to 23% in 2015. However, the borough’s rank has not experienced notable change since 2015, retaining a position amongst the 8% most deprived LAs in England (26/317) 28
Given health behaviours begin to form in childhood and both older people and children are vulnerable to the increased risk of behaviours detrimental to health and that poor health behaviours are associated and exacerbated by socioeconomic status, addressing the wider determinants of health in children and older adults in Wandsworth is important.
The King’s Fund reported that individuals with no qualifications were more than five times as likely as those with higher education to engage in all four unhealthy behaviours including low physical inactivity, alcohol, smoking and poor diet. Wandsworth has one of the most educated populations with 66.5% have degree education or above, higher than England (36.8%), as of 2021. However, 1.4% of residents have no qualifications which is around 4,000 residents. While this is lower than England (6.5%), this accounts for 4,000 residents that are at higher risk of engaging in health harming behaviours than residents with higher education 29. Alongside this, the harm from certain unhealthy behaviours is likely to be higher in certain groups, therefore the risk of harm from the same exposure can disproportionately cause harm to certain groups within the community.
1.4 Impact of the Local Environment on Health Behaviours
Increasing physical activity, improving nutrition, getting the recommended amount of good quality sleep, spending time in nature and connecting with others fostering positive relationships and reducing stressors or improving ability to cope with stressors promotes a healthier lifestyle for physical and mental health. Positive health behaviours can prevent and improve management of and improve recovery from illness as well improving general health and wellbeing. Therefore, there is potential for multiple gains from engaging in healthy behaviours and interventions to improve the health behaviour of local residents can seek to address multiple health benefits.
Understanding the basis of human behaviour can help to inform local decision making around lifestyle services and behaviour change interventions to provide effective, high quality, compassionate services.
Humans’ instinctive behaviours and responses can, in current modern-day living, be detrimental to our health and wellbeing whereas historically, these same behaviours would have been advantageous for survival. In a relatively short time the environment we live in has changed to lend itself to an increasingly sedentary, convenient lifestyle with regular access to unhealthy foods, artificial ‘rewards’ and constant exposure to stressors. However, over the same timeframe, the systems within our bodies remained largely unchanged and have not adapted to our new conditions.
2. Smoking
2.1 Smoking Prevalence
Smoking Prevalence in adults (aged 18 and over) - current smokers (APS): In 2021 - 23, Wandsworth’s rate was 9.7%, which was the 6th lowest in London, 22.1% lower than the England average and 16.7% lower than the London average. The latest Borough figure for 2021 - 23 was also 8.2% lower than in 2020 - 22, in comparison with 5.5% decrease in England’s rate in the equivalent time period.
Source: OHID: Public Health Profiles
Source: OHID: Public Health Profiles
Between 2017 - 19, 530 residents died from a smoking related death 30 and in 2019/20 there were 1,265 smoking related hospital admissions 31. In 2018-19, 112 women were smoking at time of delivery.
Smokers take more sick-leave from work than non-smokers.
Smoking increases the risk of disability and premature death.
£51,6m of potential wealth is lost from the local economy in Wandsworth each year due to smoking 32.
378 early deaths due to smoking result in 547 years of lost economic activity, costing businesses about £17.5m.
A further 118 employees in Wandsworth are economically inactive and unable to work due to smokingrelated sickness, resulting in an annual £5.7m. It is estimated that smoking breaks cost businesses in Wandsworth £20m 33.
Many current/former smokers require care in later life as a result of smoking-related illnesses. Each year these cost society in Wandsworth an additional £2.7m. There is a significant number of older people suffering from smoking attributable illnesses whose needs remain unmet by formal care. If all such individuals were instead to receive a formal social care, it would cost the system a potential further £61m 34.
It is estimated that the London Fire brigade will attend about 15 smoking-related house fires each year in Wandsworth. £2m is lost annually in the Borough as a result 35.
Smoking materials constitute 35% of all street litter. The majority of cigarette filters are non-biodegradable and must be collected and disposed in landfill sites. Smokers in Wandsworth consume about 244,010 cigarettes every day. Of these roughly 206,600 are filtered, resulting in among 35kg of waste daily. This represents 13 tonnes of waste annually, of which 5 tonnes is discarded as street litter that must be collected by the Council 36.
In Wandsworth, there are an estimated 246.1 smoking attributable deaths and 1154 potential years of life lost due to smoking related illness per 100,000 people. There are also 152.5 smoking attributable hospital admissions per 100,000 people in Wandsworth, which is less than the national average 37.
In Wandsworth there are 1,417 smoking attributable hospital admissions per 100,000. Smoking-related mortality for certain conditions are given as follows: COPD 51.0, CVD 20.0, lung cancer 53.2 (per 100,000 population) 38.
It is estimated that the annual cost of smoking in Wandsworth is £66.6m due to lost productivity (smoking breaks, sick days and early deaths), smoking related disease, social care costs, fires and passive smoking. Additional smoking related social care needs costs Wandsworth Borough Council £2.7 million per year, and local residents pay an additional £504,630 to self-fund their care 39.
As smoking prevalence increases with deprivation, the increased expenditure on smoking imposes a comparatively higher cost on proportionally more low-income households compared to high income households. Smoking rates are higher within certain groups and deprived communities and the rate of decline of smoking prevalence has not been equal among all populations. Targeting groups that are more likely to smoke is, therefore, one of the ways that services seek to reduce health inequalities.
Pregnancy
Smoking in pregnancy increases the risk of premature birth and neonatal complications, as well as miscarriage and still birth. Prevalence of smoking in pregnancy is considerably higher in more disadvantaged groups and in women under the age of 20 than in more affluent and older groups. There is, therefore, a major health inequality associated with smoking in pregnancy as disadvantaged groups are at a much greater risk of complications during and after pregnancy. Children who grow up with a parent who smokes are also more likely to be smokers themselves 40.
Smoking status at time of delivery: In 2024/25, Wandsworth’s rate was 3.9% (n=134), which was the 8th highest in London, 36.1% lower than the England average and 18.2% higher than the London average. The latest Borough figure for 2024/25 was also 11.3% lower than in 2010/11, in comparison with 55.3% decrease in England’s rate in the equivalent time period.
Source: OHID: Public Health Profiles
Source: OHID: Public Health Profiles
Young People
Discouraging young people from smoking is also a national priority. There are a number of factors associated with regular smoking amongst young people, including: having smokers at home. Many young people become addicted to tobacco before they fully understand the health risks and smoking rates amongst young people impacts on future adult smoking rates 41.
Deprivation
Smoking accounts for approximately half of the difference in life expectancy between the richest and the poorest in society 42. The prevalence of smoking increases with deprivation, as such, residents living in the 20% most deprived areas of the country are more likely to smoke than those in less deprived areas. A Government ambition is to reduce the inequality gap in smoking prevalence between those in routine and manual occupations and the general population. Smoking rates are almost three times higher among the lowest earners compared to the highest earners and smoking costs have the potential to push low-income households further below the poverty line.
Routine and Manual Workers
In England, around 1 in 4 (22.5%) people in routine and manual occupations smoked, this is around 2.5 times higher than people in managerial and professional occupations. In Wandsworth, routine and manual workers are more likely to smoke in relation to the England average (25.5% versus 22.5%).
Smoking prevalence in adults in routine and manual occupations (aged 18 to 64) - current smokers (APS): In 2023, Wandsworth’s rate was 6.6%, which was the 8th lowest in London, 66.0% lower than the England average and 56.4% lower than the London average. The latest Borough figure for 2023 was also 78.9% lower than in 2011, in comparison with 39.2% decrease in England’s rate in the equivalent time period.
Source: OHID: Public Health Profiles
Source: OHID: Public Health Profiles
Mental Health Conditions
Smoking prevalence is also higher in people with mental health conditions. A report by the Royal College of Physicians and the Royal College of Psychiatrists states that when compared to the general population, adults with a common mental health disorder (such as depression or anxiety) are twice as likely to smoke and adults with schizophrenia or bipolar disorder are three times more likely to smoke. High smoking rates among people with mental health problems are the single largest contributor to their 10 to 20-year reduced life expectancy compared to the rest of the population.
Smoking prevalence in adults (aged 18 and over) with serious mental illness (SMI): In 2014/15, Wandsworth’s rate was 38.4% (n=1252), which was the 16th lowest in London, 5.1% lower than the England average and 1.1% lower than the London average. Time series data were not available for this indicator.
Source: OHID: Public Health Profiles
Long-Term Conditions
Tobacco addiction causes and exacerbates Long Term Conditions (LTC). For example: People who smoke are much more likely to suffer from a LTC. Among those who are heavily addicted to tobacco, 44% self-report a long-term illness or disability compared with 32% of never smokers 55. People on low incomes are associated with higher rates of LTCs.
COPD caused 25,791 deaths in England in 2018 43. Smoking accounts for 86% of COPD related deaths. People with Asthma who smoke experience higher rates of hospitalisation, worse symptoms, and more rapid decline in lung function than those with asthma who do not smoke 44. Smoking significantly increases the risk of heart disease and stroke. People who smoke are 6 times more likely to have a stroke 45. People with diabetes who smoke have increased risks of complications and premature death 46.
Rates of smoking are also high among low-income groups thereby exacerbating LTCs and deepening health inequalities. Smoking is responsible for half the difference in life expectancy between the richest and poorest in society and, later in life, people who smoke are almost twice as likely to need some form of social care than never smokers 47.
The vision for the Wandsworth Health and Wellbeing Strategy 2015 – 2020 is to make Wandsworth the healthiest place to live in London by reducing the difference in health and life expectancy between the wealthiest and most deprived people.
2.2 Recent Developments to the Smoking Landscape
Nationally and locally the demand and uptake of smoking services has been affected by falling prevalence and the advent of e-cigarettes. Notably, within the last few years, new developments have been taking place at regional, sub-regional and locality levels that will influence the future direction of travel of stop smoking services. This has created a level of uncertainty regarding the emerging commissioning landscape and its impact on the provider markets.
There is a range of influences on future smoking prevalence, including the effect of e-cigarette use on smoking cessation, with new research suggesting that e-cigarettes have contributed to tens of thousands of additional quitters in England, thus accelerating the drop-in smoking rates across the country 48.
Public Health England (PHE) advise that vaping carries a small fraction of the risk of smoking. Using a nicotine-containing e-cigarette makes it much more likely that someone will quit successfully than relying on willpower alone – vaping is twice as effective for quitting smoking than NRT alone. But it is important to use UK-regulated e-liquids and never risk vaping home-made or illicit e-liquids.
Equally, it is important to address other forms of tobacco use, which are more common in certain communities. Shisha, which is one such use, creates smoke containing harmful chemicals, is becoming increasingly an area of concern. The populations where shisha is most commonly used, including BAME groups, are the same communities that are at higher risk of diseases such as heart attacks and stroke.
The health effects of Shisha smoking have received less research attention than cigarette smoking. However, the available evidence indicates that shisha smoking is associated with cancer, heart disease and lung disease. There have also been reports of increased risk of infectious disease, and the large amount of carbon monoxide created by the constant heating of tobacco by burning charcoal introduces the risk of carbon monoxide poisoning. The existing evidence base supports the need to monitor shisha smoking and minimise use, particularly regular use.
In recent decades, shisha has become more popular in western countries, particularly in young people. Despite a low prevalence of shisha use at the national level, additional data collected in specific communities highlight that shisha use is an issue of growing concern in certain areas. Local tobacco control programmes need to be sensitive to local cultural context 49.
Smokers take more sick-leave from work than non-smokers and smoking increase the risk of disability and premature death. £51,6m of potential wealth is lost from the local economy in Wandsworth each year due to smoking 50.
378 early deaths due to smoking result in 547 years of lost economic activity, costing businesses about £17.5m. A further 118 employees in Wandsworth are economically inactive and unable to work due to smoking-related sickness, resulting in an annual £5.7m. It is estimated that smoking breaks cost businesses in Wandsworth £20m 51.
Many current/former smokers require care in later life as a result of smoking-related illnesses. Each year this costs society in Wandsworth an additional £2.7m. There is a significant number of older people suffering from smoking attributable illnesses whose needs remain unmet by formal care. If all such individuals were instead to receive formal social care, it would cost the system a potential further £61m 52.
2.3 Stop Smoking Services
NICE recommends that services should aim to treat at least 5% of the estimated local population of people who smoke or use tobacco in any form each year. Of this figure, 35% are expected to be validated as 4-week quitters. Applying this figure to Wandsworth means that the annual target is 600 validated quits.
Smoking Cessation interventions are important in helping to improve people’s health, quality of life and life expectancy, as well as cut costs to healthcare and public services. In July 2017 the Government published the Tobacco Control Plan – Delivery Plan 2017-22 53. The plan identifies specific areas of focus including:
- Reduce the prevalence of 15-year olds who regularly smoke from 8% to 3% or less by the end of 2022
- Reduce smoking prevalence amongst adults in England from 15.5% to 12% or less by the end of 2022
- Reduce the inequality gap in smoking prevalence between those in routine and manual occupations and the general population by the end of 2022
- Reduce the prevalence of smoking in pregnancy to 6% or less by the end of 2022
Data relating to the local stop smoking service is provided through the data management system – Quit Manager. This data is used to determine quit figures for the borough, which are reported to the Department of Health (DoH) for inclusion within the national datasets. The Council is reliant on publicly available information, much of which has gaps in data and/or limitations in what is reported, particularly at a local level. For example, it is not currently possible to compare smoking prevalence rates at 15 years in Wandsworth to the region or England. Improved reporting of data and increased granularity in reported data would support work to increase targeting to most at risk populations and groups more likely to smoke.
The Wandsworth Business Plan emphasises the importance of investing in good local services that protect the most vulnerable. Key relatable actions include:
- Helping people get on in life
- Encouraging people to live health, fulfilled and independent lives
Two-thirds of smokers say they want to quit, however most try to do so unaided, which is the least effective method. Smokers who get the right support are up to four times as likely to quit successfully 54.
Wandsworth Council operates a successful smoking cessation service. The service is delivered in collaboration with primary care (GP surgeries and pharmacies), NHS trusts, voluntary organisations and outreach with local community venues. The Council also has a team of smoking cessation sessional workers who support delivery in stop smoking interventions across all settings. Service users are supported with access to free Nicotine Replacement Therapy (NRT) for up to 6 weeks. The Council funds NRT provided through community pharmacists.
Wandsworth Council is also part of the London Smoking Cessation Transformation Programme (LSCTP). The LSCTP vision is to change smoking behaviours and encourage more quit attempts among the general population to support London to become the first smoke free city in England by 2029. Stop Smoking London is the public facing identity of the LSCTP 55. Stop Smoking London offers telephone consultations for people who do not need face-to-face interventions or who are time-poor.
During 2018-19, Wandsworth Council supported 690 people to successfully stop smoking.
Young People
The Council works with Catch 22 56 to provide smoking cessation advice and treatment at schools and colleges. Catch 22 is a social business specialising in early intervention, and targeted support services including substance misuse to young people. Catch 22 also conducts outreach and provides workshops to educate young people about the risks associated with smoking and offers stop smoking support to smokers who want to quit.
In 2018/19 182 young people (12-18) assessed support to quit smoking. Of these, 115 were aged between 12-15, and 93 went on to quit smoking successfully.
Adults
Wandsworth Councils Stop Smoking Service 57 offers free help, advise and access to stop smoking medications to all adult smokers who live, Work or are receiving long-term treatment in the Wandsworth area.
Service provision includes: • Tips on managing withdrawal symptoms and coping with smoking triggers • Regular carbon monoxide checks • Accurate information on what to expect when trying to quit and how to deal with difficult situations • Access to stop smoking medications and guidance on using these • Nicotine Replacement Therapy (NRT) • Advise on professional help offered by GPs and pharmacists in the Borough
There are well established drop-in services at St Georges and Queen Mary’s Hospital”. These drop-in services work closely with the Hospital stop smoking leads to support in-patients, out-patients and maternity patients who require support to quit smoking. The service also supports people going into surgery that need to stop before their procedure:
- Patients who are being discharged and may need further smoking cessation support can also access these drop-in services
- Stop Smoking support is also being accessed through mental health settings through Stop Smoking Wards and Grounds Project with the mental health trust. Staff have been trained and specialist advisors have been provided to support the effective delivery of smoking cessation support at all levels.
Smoking Quitters
The effectiveness of the local sFIndmoking cessation services is measured using the proportion of smoking quitters at 4 weeks out of the estimated local smokers’ population. Successful quitters are those smokers who successfully quit at the four-week follow-up. A client is counted as a ‘self-reported 4-week quitter’ when assessed four weeks after the designated quit date, if they declare that they have not smoked, even a single puff on a cigarette, in the past two weeks.
Proportion of local smoking population who successfully quit smoking: In 2023/24, Wandsworth’s rate was 1.2% (n=312), which was the 16th highest in London, 35.1% lower than the England average and 30.1% lower than the London average. The latest Borough figure for 2023/24 was also 68.3% lower than in 2013/14, in comparison with 52.4% decrease in England’s rate in the equivalent time period.
Source: OHID: Public Health Profiles
Source: OHID: Public Health Profiles
Smokers that have successfully quit at 4 weeks (CO validated): In 2022/23, Wandsworth’s rate was 208.6 per 100,000 smokers aged 16+ (n=45), which was the 9th highest in London, 12.0% lower than the England average and 16.3% higher than the London average. The latest Borough figure for 2022/23 was also 92.7% lower than in 2013/14, in comparison with 91.0% decrease in England’s rate in the equivalent time period.
Source: OHID: Public Health Profiles
Source: OHID: Public Health Profiles
Cost per smoking quitter: In 2022/23, Wandsworth’s rate was 318.0 £ (n=110455), which was the 8th lowest in London, 47.6% lower than the England average and 48.1% lower than the London average. The latest Borough figure for 2022/23 was also 6.1% higher than in 2013/14, in comparison with 114.1% increase in England’s rate in the equivalent time period.
Source: OHID: Public Health Profiles
Source: OHID: Public Health Profiles
2.5 Evidence Based Interventions/Approaches
According to NICE, commissioners and providers of stop smoking services should implement the following approaches locally:
Use sustainability and transformation plans, health and wellbeing strategies, and any other relevant local strategies and plans to ensure evidence-based stop smoking interventions and services are available for everyone who smokes
Use Public Health England’s public health profiles to estimate smoking prevalence among the local population
Prioritise specific groups who are at high risk of tobacco-related harm. These may include:
People with mental health problems, including mental health disorders (for example, see NICE’s guidelines on depression in adults and smoking: acute, maternity and mental health services) and smoking: acute, maternity and mental health services)
People who misuse substances (for example, see NICE’s guideline on coexisting severe mental illness and substance misuse: community health and social care services)
People with health conditions caused or made worse by smoking (for example, see NICE’s guidelines on cardiovascular disease: identifying and supporting people most at risk of dying early, type 1 diabetes in adults, asthma and chronic obstructive pulmonary disease)
People with a smoking-related illness (see NICE’s guideline on lung cancer)
Populations with a high prevalence of smoking-related morbidity or a particularly high susceptibility to harm
Communities or groups with particularly high smoking prevalence (such as manual workers, travellers, and lesbian, gay, bisexual and trans people)
People in custodial settings
People living in disadvantaged circumstances
Pregnant women who smoke (see NICE’s guideline on smoking: stopping in pregnancy and after childbirth).
In addition, NICE have produced a series of evidence-based recommendations for commissioners and providers of Smoking Cessation Services, which include the following:
Ensure the following evidence-based interventions are available for adults who smoke:
- Behavioural support (individual and group)
- Bupropion
- Nicotine Replacement Therapy (NRT) – short and long acting
- Varenicline
- Very brief advice
Consider text messaging as an adjunct to behavioural support
Offer Varenicline as an option for adults who want to stop smoking, normally only as part of a programme of behavioural support, in line with NICE’s technology appraisal guidance on varenicline
For adults, prescribe or provide varenicline, bupropion or NRT before they stop smoking
Agree a quit date set within the first 2 weeks of bupropion treatment and within the first 1 to 2 weeks of Varenicline treatment. Reassess the person shortly before the prescription ends
Agree a quit date if NRT is prescribed. Ensure that the person has NRT ready to start the day before the quit date
Consider NRT for young people over 12 who are smoking and dependent on nicotine. If this is prescribed, offer it with behavioural support
Ensure behavioural support is provided by trained stop smoking staff (see the National Centre for Smoking Cessation and Training (NCSCT) training standard
3. Healthy Eating
3.1 Healthy Eating Definition
A healthy, balanced diet is vital to enable optimal health and wellbeing. In eating a wide variety of foods in the right proportions, we ensure enough intake of the nutrients essential for health. Forming part of healthy eating, good nutrition is not simply defined as following a diet which is low in fat, salt and sugar, rather it is eating a wide range of nourishing foods to enable the body to function well and help to protect against disease. This includes eating essential vitamins and minerals, as well as an appropriate energy (calorie) and macronutrients (fat, protein and carbohydrate) intake.
Consuming a healthy diet throughout the life course helps to prevent health problems caused by poor diet, as well as a range of non-communicable diseases and conditions. Current nutrition guidance from Public Health England (PHE) and the NHS, recommends that balance is the key to a healthy diet. Eating a variety of foods in the right proportions and consuming a suitable amount of food and drink during the differing life stages, will achieve and maintain a healthy body weight and help prevent diet-related health conditions.
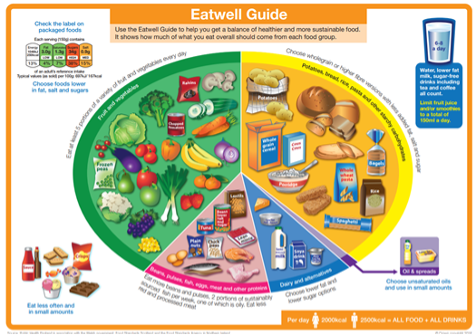
Expert evidence-based scientific research forming these guidelines, promotes a diet based on starchy carbohydrate foods such as potatoes, wholegrain bread, rice and pasta; plenty of fruit and vegetables (recommendation is at least five portions a day); protein-rich foods such as meat, fish, tofu and lentils; milk and dairy foods; and limited fat, salt and sugar. By following these recommendations, intake of dietary fibre and ‘free’ sugars along national regulations will be easier to achieve; currently these two food groups are under and over consumed respectively across the general population.
The PHE ‘Eatwell Guide’ 59 presented in Figure 28 highlights the different types of food that make up our diet and illustrates the proportions that should be eaten to achieve the recommendations.
3.2 Healthy Eating and Nutrition
Poor diet is a public health issue as it increases the risk of some cancers and cardiovascular disease (CVD), both of which are major causes of premature death. Dietary risks, such as low fruit and vegetable intake and obesity contributes to approximately one third of all deaths from cancer and CVD 60. These diseases, along with type 2 diabetes (T2D), which increases CVD risk, are associated with obesity, which has a very high prevalence in adults in London and England 61. Alongside obesity, it is important not to forget the impact of malnutrition; under-eating, not having enough protein, vitamin rich foods and dehydration can also cause health problems, particularly amongst the young 62 and elderly 63.
According to the National Institute for Health and Clinical Excellence (NICE), healthier diets could prevent around 1 in 20 cancers [URL: https://www.cancerresearchuk.org/about-cancer/causes-of-cancer/diet-and-cancer]. Regularly eating foods high in fibre can reduce the risk of some cancers and over consumption of processed and red meat, and alcohol can increase the risk of some cancers. Furthermore, controlling intake of salt, saturated fats and transfats can reduce the risk of CVD 64. CVD is often caused by high blood pressure and high cholesterol, which can potentially be reduced without the need for medication by following a healthy diet and exercise plan.
The impact of good nutrition on brain health can also not be dismissed. Malnutrition affects both mental and physical wellbeing. Eating a nutrient-rich diet, particularly one that has lots of fruits and vegetables, omega 3 fats, and low amounts of sodium and saturated fats, helps to maintain good brain health, which is important for the prevention of dementia 65, coronary heart disease, high blood pressure and high cholesterol; all these conditions can also be alleviated, to some extent, by following a healthy diet. Promoting optimal nutrition for all Wandsworth residents is important to prevent the onset of these long-term conditions.
The way we shop, cook and eat food has changed significantly over the last decade, particularly with the availability and affordability, of fast food and eating out. The increased production of processed food, rapid urbanisation and changing lifestyles has led to a shift in dietary patterns. People are now consuming more ‘ultra-processed’ foods, which are high in energy, saturated fats, free sugars and salt/sodium. Consequently, a significant proportion of the population are not consuming adequate intakes of fruit, vegetables and dietary fibre 66. The number of takeaways in London alone has increased from 4,100 in 2010 to 5,335 in 2018 . The introduction of smart phone apps has made it even easier to have fast food delivered to home or work and this market has increased by 72% in the last decade 67.
The food market has shown some positive steps towards healthy eating. For example, there are several companies offering households to subscribe to fruit and vegetable boxes or for deliveries of fresh ingredients to enable them to cook from scratch with pre-prepared ingredients delivered to homes and this represents a positive step towards healthy eating at home. However, this approach tends to serve those who have the financial resources and there remains population groups who face attitudinal, financial or knowledge barriers to benefit from healthy eating.
The issue of being overweight or obese is usually given most attention when healthy or unhealthy eating is being discussed. However, it is important to consider the other less visible effects of unhealthy eating and poor nutrition; the risk this poses to health and the groups who may be most affected. For example, a diet with high salt intake or low vitamin consumption may not cause weight gain but can still put an individual’s health at risk.
Sustainability and waste are also an issue associated with food. It is estimated that food and drink accounts for 10% of London’s total consumption-based greenhouse gas emissions. For every two tonnes of food eaten in the UK, another tonne is wasted 68. Climate change impacts on fuel and food prices, which further impact on population groups that are already disadvantaged or vulnerable.
Healthy Behaviours
Current UK diet and nutrition recommendations include 69:
- At least 5 portions of fruit and vegetables per day for those aged 11 years and over.
- For adults (ages 19 and over), average intakes of red and processed meat should not exceed 70 grams per day * At least 1 portion of oily fish (140 grams) per week for all ages (equivalent to 20 grams per day).
- Limit free sugars to no more than 5% of daily calorie intake.
- Limit saturated fat intake to no more than 11% of daily calorie intake.
National trends in diets indicate that the general population may not be consuming the right foods to support a healthy lifestyle:
- Ready meals and convenience meat products continue a clear upward purchasing trend.
- Purchases of fish and fish products are falling steadily.
- Fresh green vegetables have shown slight downward trend, however, there has been a 5 % increase in purchase of other fresh vegetables.
- Potato purchases continue a downward trend.
- Purchases of both white and wholemeal bread have fallen.
- Milk purchases have generally declined over the last 10 years.
- Between 2013 and 2016/17, purchases of takeaway food brought home have increased by 10%. Expenditure on takeaway foods was £2.17 per person per week in 2016/17, 23% higher than in 2013.
3.4 Dietary Behaviours in Wandsworth
In Wandsworth, the proportion of adults meeting the recommended ‘5 a day’ on a usual day is broadly similar to the London and England average (58% vs 55%). In Wandsworth, 44% adults are reported to drink more than the recommended units of alcohol a week, which is the highest in London and well above the London average (26%).
Whilst there is no local data available about the diets of Wandsworth residents, the National Diet and Nutrition Survey (NDNS) provides an indicator that adults may not be consuming the right foods to support a healthy lifestyle 80:
- The average daily intake of ‘free’ sugars (those added to food or drinks, or found naturally in honey, syrups and unsweetened fruit juices) is 11%, which is double the recommended daily intake of no more than 5%. Main sources of free sugars in all age groups are biscuits, buns, cakes and pastries; sugar, preserves and confectionery; cereal and cereal products; sugar sweetened beverages (SSBs) (including fruit juice), and for adult men, beer, lager and cider are also contributors 81.
- Only 9% of 19-64-year-olds and 7% of those aged 65 and above are meeting the recommended daily intake of fibre of 30g per day 82. Main sources of fibre include wholegrains (for example, brown pasta, breads and oats), vegetables and fruit (including their skins and peel)
- Average weekly consumption of oily fish is 77g which is around half the recommended amount (140g). Oily fish includes anchovies, carp, trout, mackerel, herring, pilchards, salmon (including canned), sardines, sprats, swordfish, tuna (fresh only)
Diet-related Health Conditions
Obesity prevalence in adults, (using adjusted self-reported height and weight): In 2023/24, Wandsworth’s rate was 15.3%, which was the 7th lowest in London, 42.2% lower than the England average and 24.4% lower than the London average. The latest Borough figure for 2023/24 was also 7.9% higher than in 2015/16, in comparison with 17.1% increase in England’s rate in the equivalent time period.
Source: OHID: Public Health Profiles
Source: OHID: Public Health Profiles
Obesity increases the risk of a range of chronic diseases, particularly T2D, stroke and coronary heart disease. In the Wandsworth Borough the annual estimated NHS prescribing cost of T2D is just over £4million for those over the age of 17 years and estimated overweight and obesity costs are £47.1 million. In the UK obesity related disease cost the NHS more than £6bn per year and are calculated to impact wider society to the amount of £27bn per year 83. Unless significant action is taken, it is estimated that by 2050 overweight and obesity will cost the NHS £9.7bn per year, with societal costs of £49.9bn 84.
Some health conditions are preventable by following a healthy diet and maintaining a healthy weight. The most notable diet-related health conditions are cardiovascular disease such as T2D, heart disease, circulatory conditions such as high blood pressure and some cancers. The data for Wandsworth shows that:
- Early mortality (under 75 years) from CHD is significantly lower than the England rate and is the fourth lowest in London
- Mortality from cancer is lower than the average for London and England
- Diabetes prevalence is one of the lowest in London (4.3%). However, it is estimated that approximately 7% of people are living with diabetes (type 1 or type 2), both diagnosed and undiagnosed
Whilst this appears to paint a positive picture, these preventable causes of death do contribute to a life expectancy gap between those living in the most and least deprived quintiles in the Borough. For example, amongst males, circulatory conditions and cancer are the biggest contributors to the life expectancy gap, responsible for 26.8% (or 1.5 years) and 21.8% (or 1.2 years) respectively. In females, circulatory conditions and cancer are the biggest contributors to the life expectancy gap, responsible for 25.2% (or 1.1 years) and 15.2% (or 1 year) respectively (please refer to the chapter People for more detail).
Deprivation
Wandsworth is split into 20 wards. Conducting an analysis by ward allows us to delve deeper into the areas of the Borough and identify if there are any wards where there is a greater need in relation to healthy eating. It is known that income and deprivation provide indicators to health and diet related disease. Indeed, the life expectancy gap between the most and least deprived quintiles in the Borough (i.e. households with the highest income and lowest income) is 5.6 years for men and 4.6 years for women. CVD represents the largest gap amongst both men and women.
It is therefore useful to identify parts of the Borough which may
have a higher concentration of adults and families on the lowest income
i.e. the most deprived areas as this will help to target resources and
support for healthy eating. This is particularly in relation to
preventing diet-related ill health. The map below illustrates the wards
of according to income / deprivation. 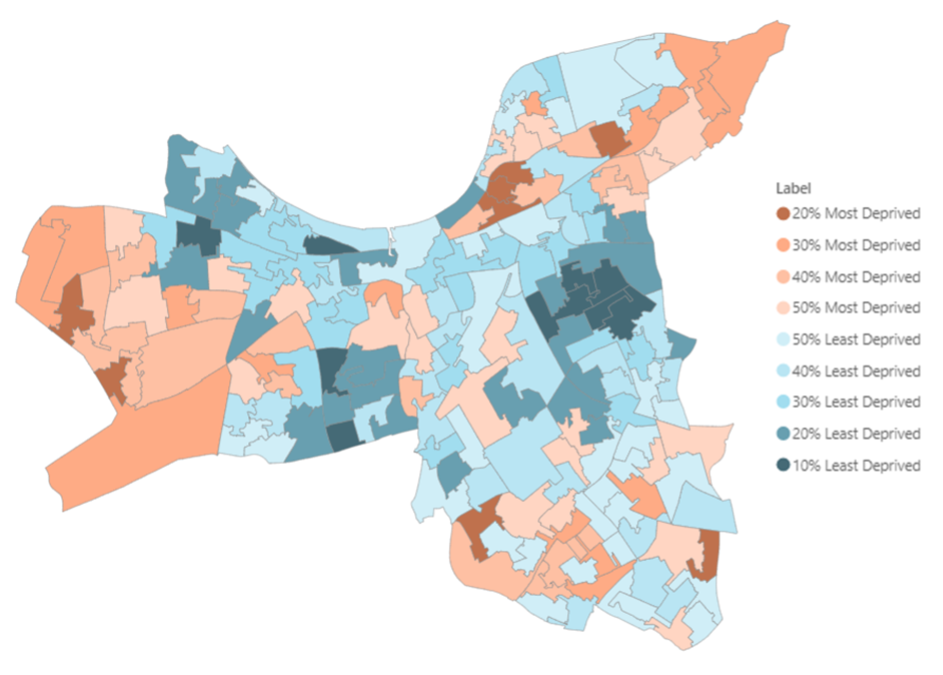
As mentioned above, income and deprivation are useful indicators to examine when considering population health. Income is closely associated with food poverty and food consumption, so it is important to highlight areas of the Borough which may have a greater proportion of households on low income. The map below shows a breakdown of the Borough according to income score and this provides useful data to identify areas which might need targeted support.
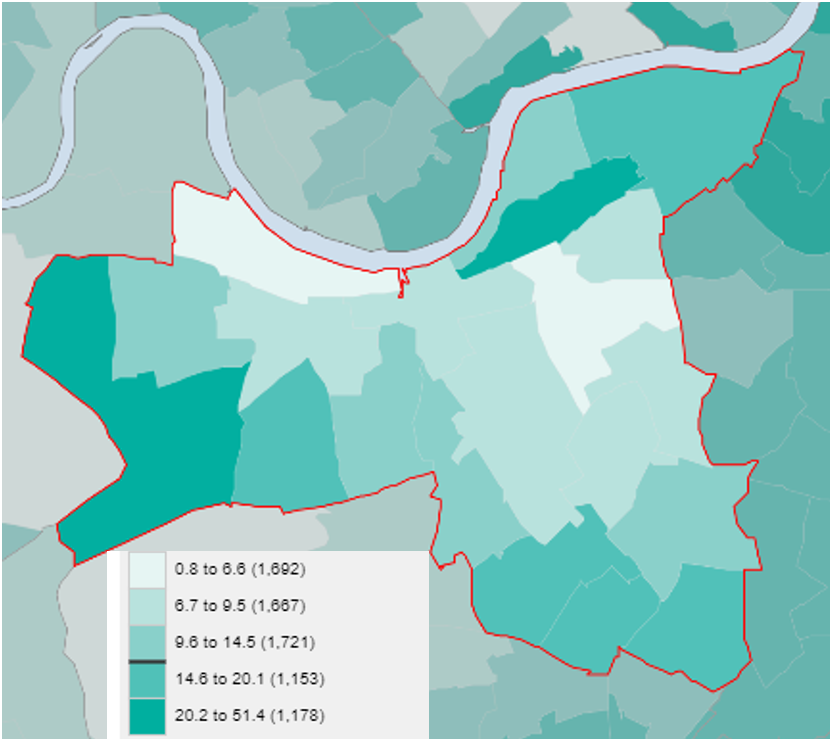 The darkest areas represent wards in Wandsworth which have the highest
percentage of income deprived households reliant on means tested
benefit. These two wards with the highest are Latchmere and Roehampton
and Putney Heath.
The darkest areas represent wards in Wandsworth which have the highest
percentage of income deprived households reliant on means tested
benefit. These two wards with the highest are Latchmere and Roehampton
and Putney Heath.
In Wandsworth, the density of fast-food outlets is similar to London (measured at 98.0 per 100,000 people in the Borough) and is above average for the rest of England (NB this data was reported in 2014). Whilst not all fast food is unhealthy, it can be high in calories, saturated fat and salt, plus low in fibre, fruit and vegetables.
Foodbanks providing emergency food supplies increased by 78% from previous 5 years with one-third of Foodbanks being for children of primary school age. Wandsworth ranked 6th lowest Borough in London for fuel poverty with 1 in 10 households experiencing poverty.
Overall, the areas which would achieve most impact from healthy eating messages, support and interventions are within the wards of Latchmere, Roehampton and Putney Heath, Furzedown and Tooting. These interventions would benefit from being tailored to take account of cultural influences on diet and food choices.
Ethnicity
Considering the risk factors mentioned earlier, adults from South Asian and Black African, Black Caribbean groups are at greater risk of being affected by diet related disease and it is important that are equipped to take steps to prevent this through healthier diets.
People from Black and Minority Ethnic Groups make up 30% of the population in Wandsworth. Major specific ethnic groups, other than white British, in Wandsworth are Somali and Pakistani. These groups may also be more likely to follow differing diets which are influenced by culture and lifestyle.
In a review carried out by the British Nutrition Foundation 85, the dietary habits of minority ethnic groups are influenced by a range of factors, including income, socio‐economic status, food availability and access, health, religion and dietary laws, food beliefs, amount of time available for food shopping or preparation, generation and gender. The traditional dietary habits of minority ethnic groups vary widely but there is also heterogeneity within each group reflecting different countries of origin and/or native regions. The same review of evidence identified foods which are more frequently eaten by different ethnic minority groups, which can contribute to poorer health. It also cited that overall fruit and vegetable consumption was lower and salt added to food in cooking and at the table tended to be higher amongst BAME groups.
The BAME population is higher in the south and north east of the Borough. Thamesfield ward had the greatest proportion of White/White British ethnic group at 88%, while Tooting ward had the highest proportion of Asian/Asian British at 29%. Latchmere ward had the greatest proportion of Black/Black British ethnic group. These residents may need more information and support relating to maintaining a healthy diet, particularly around the prevention of T2D.
People with a Caring Responsibility
There are 19,728 Carers living in Wandsworth, 6.5% of the population, who are responsible for providing care for a friend or family member. One in ten Carers in a Wandsworth Survey that they have experienced loss of appetite as a result of their caring role and 16% felt they were neglecting themselves in relation to eating well or getting enough sleep.
Disability
Data from the Clinical Commissioning Group shows there are around 5,500 adults with a learning disability living in the Borough of Wandsworth. Around 200 adults with a learning disability live independently in supported living accommodation. These individuals may need support with buying and preparing healthy food. Using national estimates, this could also mean that around 2,200 adults with learning disabilities in Wandsworth are obese which puts them at greater risk of health complications.
Being Overweight or Obese
Analysis of QOF data on obesity from GP surgeries shows that GP surgeries in the Borough with the highest proportion of patients recorded as obese are also located in Latchmere, Roehampton and Furzedown wards.
Living Alone
Research has shown that people living on their own can lead to a less healthy diet and more regularly opting for takeaway, fast food or pre-packaged dinners. A recent review of evidence suggests that living alone could negatively affect some aspects of food intake and contribute to the relationship between living alone and poor health outcomes. In Wandsworth, it is estimated that almost a third of residents live alone.
3.5 The Obesogenic Environment
In recent years Britain has become a nation where being overweight is prevalent; by 2050, around 50% of adults and 25% of all children under 16 could be obese 86.
Today’s ‘obesogenic’ environment, with its abundance of convenience and energy dense foods and increased sedentary lifestyles, reducing the prevalence of obesity is challenging. Exposure to fast food through advertising is known to influence the purchase and consumption of food and forms part of the issue that need addressing around the obesogenic environment. Locally, Public Health carried out a snapshot of fast-food adverts in Wandsworth and found that of the adverts advertising food products, the vast majority were for foods high in fat, salt and sugar.
A report published in 2018 by Cancer Research UK found young people who recalled seeing junk food adverts were more than twice as likely to be obese. The same study identified 87% of young people found adverts for high fat, salt and sugar products appealing, with three quarters tempted to eat a product after seeing such an advert. The purpose of the ban is to reduce this exposure to foods and drinks high in fat, salt and sugar and therefore reduce the likelihood of those foods being purchased and consumed.
3.6 Limitations to the Data/Information
Additional data would assist with building a more comprehensive picture locally about diet and nutrition. For example, the following health related behaviour measures relating to food and drink would be useful at a Borough level:
- Local data on fast food consumption and takeaway usage
- Local data based on diet and nutrition survey measures
- Local barriers to following a healthy diet
- Level of skills and education levels amongst adults around preparing nutritious meals
- Data on fizzy drink consumption
- Data on felt need/perceived need in relation to healthy eating
- Data from adults with learning disability about healthy eating
3.7 Current Services
The Council offers both public facing services and policy approaches to support healthy eating for adults in particular groups. These are as follows:
- Men’s Weight Management Programme Guys Get Active - In partnership with Wandsworth Council, Enable Leisure and Culture are relaunching a programme to help local men lose weight. Adapted to suit the current climate, Guys Get Active incorporates weekly physical activity and nutrition sessions delivered face to face as well as virtually. The programme is focused on creating peer to peer support between men who want to lose weight and improve their health. Led by qualified professionals who can adapt the exercises to suit individual needs, Guys Get Active is perfect for all abilities and fitness levels. These sessions are exclusively for men who live, work or are registered with a GP in the Wandsworth Borough with a BMI of 27.5+ or a diagnosis on type 2 diabetes, and a willingness to lose weight
- Wandsworth offers residents an Adult Weight Management Programme which offers vouchers for 12 weeks membership to either Slimming World or Weight Watchers. The vouchers are offered through GP or self-referral
- Including healthy catering criteria in Commissioned Service Contracts, for example Age Well Centres and Leisure Centres. Plans are being developed to influence the food environment by reducing exposure to unhealthy food through retail planning, healthy catering for restaurants and takeaways. The council is also considering the feasibility of limiting exposure to high fat salt sugar foods through advertising and marketing restrictions
- Including healthy eating criteria in the Quality Assurance Process in contracted supported living providers with a contract in Wandsworth
The Voluntary Sector also provides a number of services and projects for Wandsworth residents to help them and their families to eat healthily, particularly those who are low income or in need of emergency support. For example, Wandsworth Foodbank, Wandsworth Food Partnership and Waste Not Want Not, a food sharing and food sourcing scheme in Battersea. Age UK also offer support for older people such as the Man With A Pan cooking initiative for older men who live alone.
3.8 Evidence Based Interventions/Approaches
Evidence Based Marketing and Campaigns
PHE and the NHS deliver two key marketing campaigns to support healthy eating amongst adults One You and One You: Nutrition on the Go to support eating out 87
There is also the Sugar Smart campaign which is delivered by Sustain and supported by PHE 88. This campaign has been adopted by other Boroughs across London and England.
NICE Guidance and Quality Standards
There is a wide range of NICE guidance on healthy eating and nutrition, which recommends evidence-based interventions. Also cited here are NICE Guidance and Quality Standards for the prevention obesity and excess weight gain and type 2 diabetes:
- Preventing excess weight gain (NG7)
- Obesity prevention (CG43)
- Weight management: lifestyle services for overweight or obese adults (PH53)
- Weight management before, during and after pregnancy (PH27)
- Cardiovascular disease prevention (PH25)
- Promoting health and preventing premature mortality in black, Asian and other minority ethnic groups (QS167)
- Obesity in adults: prevention and lifestyle weight management programmes (QS111)
- Obesity: working with local communities (PH42)
- Type 2 diabetes prevention: population and community-level interventions (PH35)
- Dementia, disability and frailty in later life - mid-life approaches to delay or prevent (NG16)
4. Physical Activity
Physical Activity (PA) is universally acknowledged to be an important part of healthy functioning and well-being. An active lifestyle is essential for health and the health benefits of routine PA and exercise 89 participation is irrefutable. PA reduces the risk of many preventable diseases, from cancer to diabetes, and conditions like obesity and depression 90. PA increases your chances of staying independent in later life, thereby reducing demand for NHS an Adult Social Care services.
National Picture of Physical Activity
The national picture shows that over the last 50 years, the UK has experienced a 20% decline in PA levels (UK Active, 2014). It also shows that around 1 in 3 or 34% of men and 1 in 2 or 42% of women are not active enough for good health 91. The good news is that Wandsworth has over the past few years countered that trend. Wandsworth is currently way ahead of both the London and England average with circa 79% of residents (estimate of circa 211,60) self-reporting being physically activate and 13.6% as being inactive (circa 36,500 people aged 20 years or more) in the Active Lives Survey (November 2018/19)92, pre-pandemic. During the pandemic inactivity levels rose at the expense of people reporting being active or ‘fairly active’ 93 but these were considered not significant changes by Active lives Survey report. The latest figures (period May 2020/21) are 73.3% active (150+ mins) and those who are inactive has increased to 17.9% (circa 48,400 residents) 94. Regarding the latter that represents and additional circa 11,900 inactive people compared to almost 2-years ago.
The UK has experienced a 20% decline in PA levels (UK Active, 2014) to date. PHE estimates that if this trend continues, without any preventive measures, the number of people who are less active will increase to 35% of the UK population by 2030.
Wandsworth’s total population is circa 328,828 residents and is due to grow to circa 373,000 by 2029. The number of adults aged 18 years and over is circa 267,600 or from 20 years and above c.258,762 (second largest in Inner London). Wandsworth population is characterised by a higher percentage of people aged 26-34, a highly educated population, higher than average employment rates. The data we have on PA and inactivity is not broken down by age, nor do we have Wandsworth data by gender, ethnicity nor locality.
Declining Trend in Physical Activity
Over the last 50 years, the UK has experienced a 20% decline in PA levels (UK Active, 2014). If current trends continue unchallenged then it is estimated that 35% of people would become less active by 2030 . If applied to Wandsworth we would see the number of inactive people grow, based on May 2018/19 figures, from circa 13.6% (36,500 people aged 20 years or more) to circa 22.8% (54,618 people aged 30 years or more) by 2029. Sport England’s latest Active Lives Survey found that a quarter of adults (11.3 million) do less than thirty minutes of activity per week in the UK
The Active Wandsworth Strategy
The Active Wandsworth Strategy 2017-2021 has four key themes with several key outcomes and associated objectives. These all help to increase PA as part of a holistic approach, addressing both individual factors Such as psychology, food consumption, physical activity and biology as well as societal influences (this includes changes in the range, marketing, price and accessibility of energy-dense foods, which make it ‘harder to avoid’ obesity (King’s Fund), active travel, use of green spaces, etc ), to improve residents’ health and well-being. This approach also seeks to scale up professional to community-led initiatives that will make people more active.
The Active Wandsworth Strategy is due to be renewed in 2022/23 for the next 5-years. This JSNA will support and inform that process.
4.1 Physical Activity Guidelines
Both OHID and the UK Chief Medical Officer (CMO) have produced PA Guidelines, that cover older people, pregnancy and disability. These are summarised below.
Office for Health Improvement and Disparities (OHID)
Tackling physical inactivity is critical to delivering many national priorities e.g., reducing Dementia and Obesity rates and giving every child the best start in life.
Being physically active is define as doing at least 15 moderate intensity equivalent (MIE) minutes of PA per week 95 or more in the previous 28 days. Alternatively, this can be achieved by 75 minute of vigorous intensity activity a week or more. Physically inactivity is defined as doing less than 30 MIE minutes of PA per week. For adults not reaching 150mins the guidance also says doing ‘more’ will always be beneficial. But the most benefits are achieved at 150 MIE.
Being physically active is define as doing at least 15 moderate intensity equivalent (MIE) minutes of PA per week or more in the previous 28 days. Alternatively, this can be achieved by 75 minute of vigorous intensity activity a week or more. Physically inactivity is defined as doing less than 30 MIE minutes of PA per week.
OHID guidance also states that a well a being physically active, all adults are advised to minimise the time spent being sedentary for extended period. Even among individuals who are active at the recommended levels, spending large amounts of time being sedentary increases the risk of adverse health outcomes, see Health matters: getting every adult active every day.
UK Chief Medical Officer
Adults and older people should:
- Do at least 150 minutes (moderate intensity) or 75 minutes (vigorous activity) or a combination of moderate and vigorous PA per week, nonetheless some exercise is good, more is better
- Include strength and balance activities two days per week
- Older adults at risk of falls should also incorporate balance and coordination PA at least two days per week
- Minimise sedentary behaviours
World Health Organisation
The term PA should not be confused with exercise which is a subcategory of PA which is planned, structured, repetitive and aims to improve or maintain one or more components of physical fitness. Beyond exercise, any other PA that is done during leisure time, for transport to get to and from place, or as part of a person’s work, has health benefits.
The most recent updated guidelines also include advice on safe levels of activity for pregnant and postpartum women as well as older people.
4.2 Impact and Benefits of Physical Activity
Being active is also good for adults, children and old alike. Prevention has become increasingly important in recent years, as the cornerstone of the drive to improve peoples’ health and well-being as well as their quality of life. PA helps reduce peoples’ need for high-cost health treatments and care services. Therefore, prevention is now seen as everyone’s business and PA remains one of the core elements of a healthier lifestyle. PA also helps us get out our homes and connect with others, avoiding social isolation. It also helps mitigate against substantial economic burden 96, as well as increasing social capital and community spirit.
The importance of being physically active and not having sedentary lifestyles is championed by CMOs. They advocate that the strength of the relationship between PA and health outcomes persists throughout people’s lives, highlighting the potential health gains that could be achieved if more people become more active throughout the life-course 97.
This ties into the Council’s public health prevention focus on Start Well, Live Well and Age Well in this JSNA. Regarding the latter the evidence according to CMO is that:
- Regular PA contributes to the key determinants of healthy ageing: good physical and mental function; opportunities for social interaction; a sense of control over, responsibility for one’s own health and well-being; and managing or coping with disease symptoms and functional limitations.
- Increasing PA contributes to improving social functioning and reducing loneliness and social isolation, especially as you age
- PA contributes to increased physical function, reduced impairment, independent living, and improved quality of life in both healthy and frail older adults
- PA in later life can help treat and offset the symptoms of a range of chronic conditions (e.g., Depression, CVD, Parkinson’s Disease)
- New evidence, [specifically for older people] has strengthened and reinforced the main elements of those
The benefits of PA are not only vast for the individual, but it is also the same at a societal level. On an international scale, PA has been recognised as a contributing factor towards 13 of the 17 United Nations Sustainable Development Goals 98. At a societal level, the higher the percentage of people engaged in PA can assist in tackling many of the important health and social care challenges faced by Wandsworth Borough and it can also have a positive economic impact. In relation to a positive economic impact, it is estimated that a 1% reduction in inactivity levels results in savings equivalent to £44 per household, and it also helps improve the health and well-being of the local community. The benefits of being physically active are summarised in the table below.
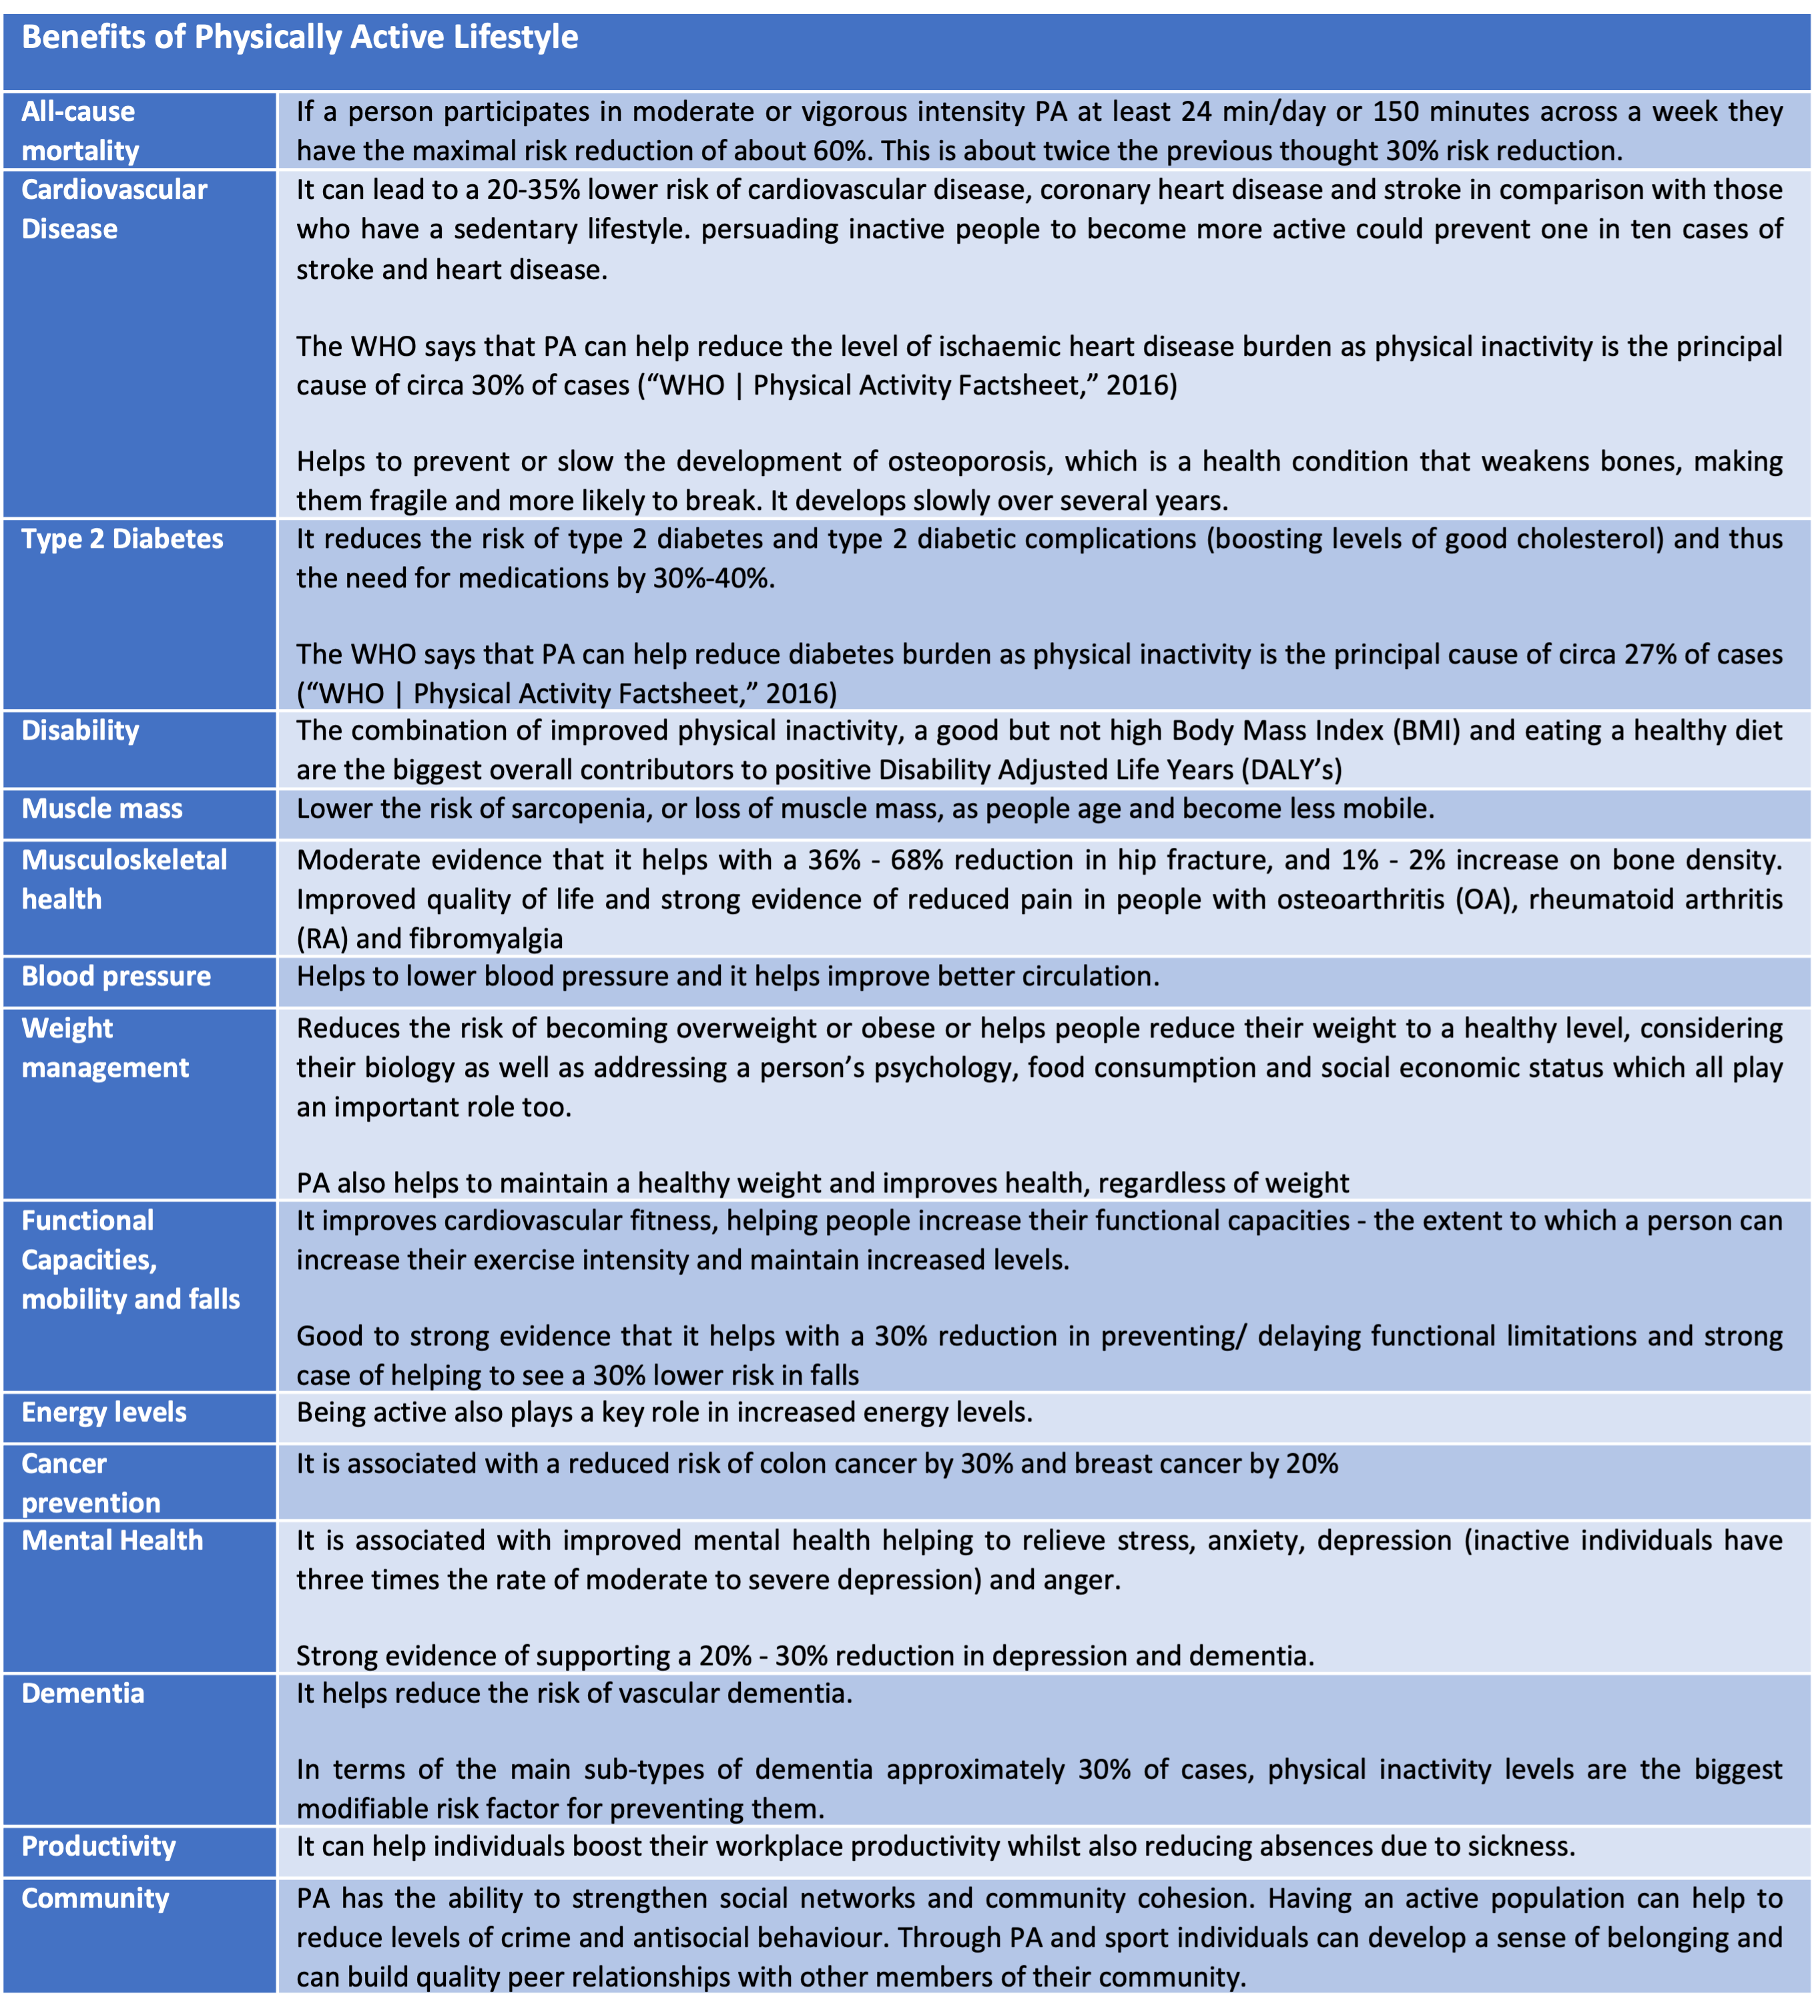
In terms of health, it increases peoples’ risk and likelihood of developing disabilities and diseases. Inactivity and sedentary lifestyles and resulting overweight and obesity are both associated with higher risks of developing chronic diseases such as coronary heart disease (CHD), hypertension, stroke, type 2 diabetes, and certain forms of cancer such as breast and colon. It can also lead to increasing / multiple co-morbidities and can reduce life expectancy 99. As you get older these risks become greater according to CMOs.
In fact, inactivity is the fourth largest cause of disease and disability in the UK 100. At worse, inactivity and a sedentary lifestyle are one of the top leading risk factors of death 101. For example, physical inactivity is responsible for one in six UK deaths, equal to smoking, and globally is the 4th leading risk factor for mortality accounting for 6% of deaths globally 102. Also, higher sedentary time is associated with a higher risk of death and that this risk increases at levels greater than 9.5 hours a day.
At a societal level, inactivity and sedentary lifestyles puts pressure on both tight local government and NHS resources and funding, making services unsustainable. Across the UK physical inactivity is costing the UK an estimated £7.4bn a year 103. For example, long-term conditions such as diabetes, cardiovascular and respiratory disease not only increase hospital admissions and GP visits. It can also lead to greater dependency on home, residential and ultimately nursing care, which puts a drain on resources as well as the personal strain it puts on families, individuals, and carers 104. If current trends continue, and become more reflected in Wandsworth, the increasing costs of health and social care could destabilise public services and is likely to take a toll on the quality of life for individuals, carers and communities.
Importance of Targeting Inactivity and Increasing Impact on Health
According to the CMO, targeting and supporting inactive people to become more active, even if falling short of the recommended levels of activity, is where the biggest public health gains lie 105. Therefore, getting inactive people to become active has greater health benefits than getting active people to do more activity. This is something that will take time to accomplish. The best approach to reducing sedentary time and subsequently increasing total PA is to take small steps as this is likely to be achievable for the majority of people 106. This is supported by Sports England, Sporting Future Strategy where they maintain that we must have a stronger focus on tackling inactivity.
“Sporting Future makes it clear that in the past much of the action and funding supported people who would probably have been active anyway. It is important to ensure they continue to be catered for, however the biggest gains and the best value for public investment are found in addressing the people who are least active. This is based on scientific evidence. The figure below shows the value of getting people active from different starting points 107. It illustrates that although increasing the activity of an already active person (say from 200 minutes to 300 minutes a week) will benefit that individual’s health, it is nowhere near the benefit experienced by a sedentary person who takes up even a small amount of activity”.
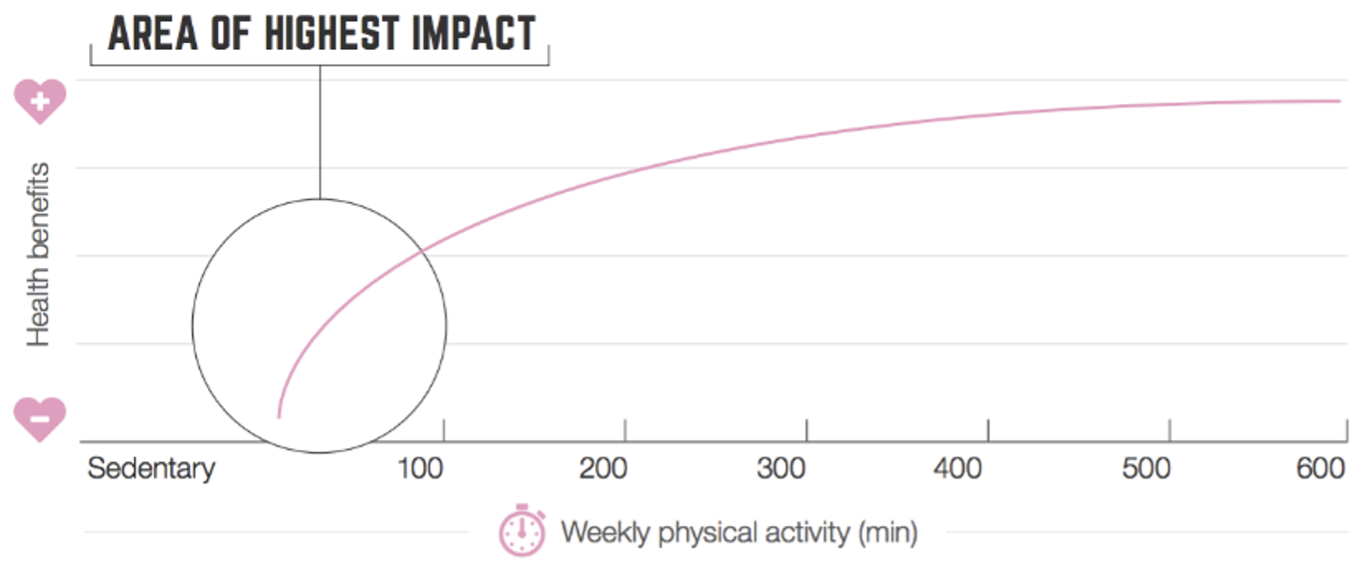
Source: Sport England Strategy 2016-21, Nigam 2011 108
The predominant focus in the past has been on individual-level factors. There is now a movement to focus more on determinants which are at the other end of the ecological model spectrum. They take a broader view of health behaviour causation, with the social and physical environment included as contributors to physical inactivity, particularly those outside the health sector, such as urban planning, transportation systems, and parks and trails. In addition, more recent research on determinants is now identifying genetic factors that contributes to the propensity of people to be physically active as well as evolutionary factors and obesity that might predispose certain people to inactivity. An understanding of correlates and determinants as advocated by the ecological model (the figure below) it is argued would reduce the effect of future epidemics of inactivity and contribute to effective prevention of non-communicable diseases.
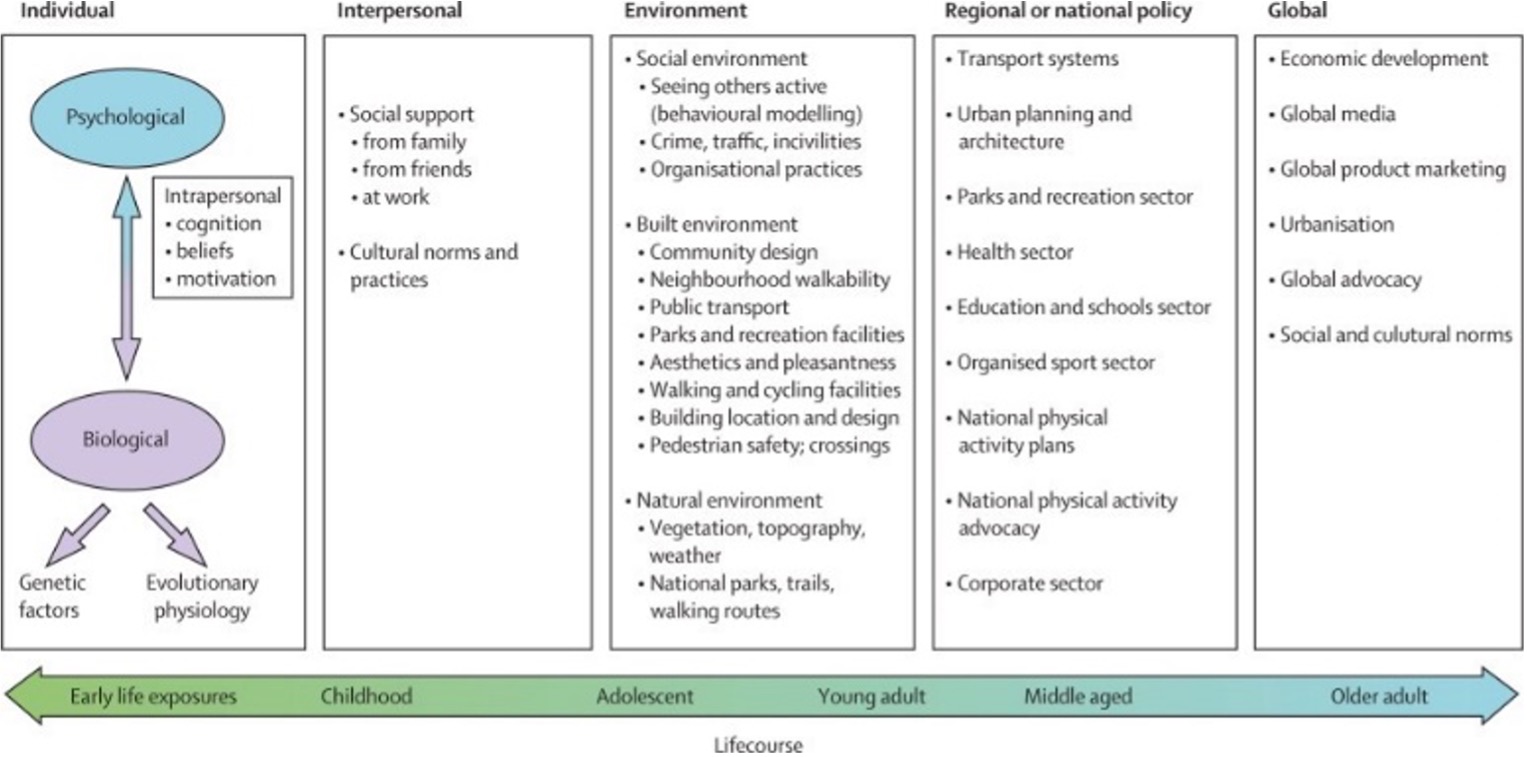
Source: Bauman et al, Correlates of physical activity. The Lancet 109
4.3 Prevalence and Picture of Physical Activity
The Active Wandsworth Strategy 2017-2022 was put in place in 2018 to address inactivity by striving to make Wandsworth the most physically active Borough in London. Wandsworth needs to continue to build on the success of the Active Wandsworth Strategy (2017-22), which drew on a several key strategic themes with associated outcomes and objectives.
Adverse Impact of Physical Inactivity and Sedentary Behaviours
Percentage of physically inactive adults: In 2023/24, Wandsworth’s rate was 16.4%, which was the 8th lowest in London, 25.2% lower than the England average and 27.6% lower than the London average. The latest Borough figure for 2023/24 was also 4.7% higher than in 2015/16, in comparison with 1.5% decrease in England’s rate in the equivalent time period.
Source: OHID: Public Health Profiles
Source: OHID: Public Health Profiles
Physical Activity Levels in Wandsworth
Wandsworth had seen the number of people self-reporting as being inactive fall from 18.7% in 2015 to 13.6% in the period November 2018/19 Active Lives survey, but then rise again to 17.9% in the period May 2020/21 due to the COVID-19 pandemic 110. There was some improvement in the number reporting being only fairly active, 7.3% (May 2018/19) and more recently 8.7% (May 2020/21). Sport England also report that in 2016/17 Wandsworth had 82% participation in PA and sport at least twice in the last 28 days. This is much higher compared to London average of 77%. In addition, Sport England reports that, “Wandsworth has a greater percentage of people who are limited by illness or disability participating in PA than London” 111 . These are all encouraging figures, but it is important to bear in mind that these are all based on self-reporting surveys which have been known to be influenced by over-reporting or misunderstanding of what each category of intensity actually means.
In the period November 2018/19, Wandsworth achieved a significant 8.9% increase in residents being categorised as active compared to the previous year (Sport England’s annual Active Lives Survey). At that time, circa 79% of Wandsworth’s adult population, up from 69.3% in 2015 , achieve 150 minutes of PA per week – see the table below. This far exceeds London’s and the national figures of 64.4% and 63.2% respectively, representing a significant increase of 9.3% since measurement began in 2015.
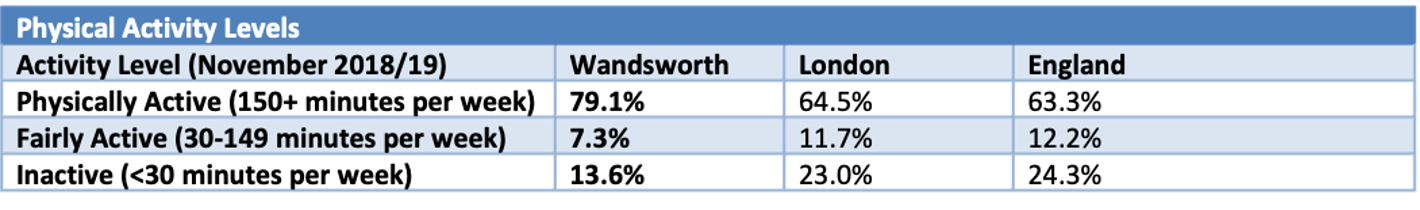 Source: Public Health England (based
on Active Lives, Sport England) 112
Source: Public Health England (based
on Active Lives, Sport England) 112
Percentage of physically active adults: In 2023/24, Wandsworth’s rate was 74.8%, which was the 8th highest in London, 11.0% higher than the England average and 12.1% higher than the London average. The latest Borough figure for 2023/24 was also 1.4% higher than in 2015/16, in comparison with 1.9% increase in England’s rate in the equivalent time period.
Source: OHID: Public Health Profiles
Source: OHID: Public Health Profiles
Physical Inactivity Attributable Factors for Poor Health
The people who are inactive and have sedentary behaviours and lifestyles have greater risk of poor health and mental health. It is known that a mixture of physical inactivity, unhealthy diets and high BMI is the largest overall contributor to disability-adjusted life years (DALYs).
Government research shows that over a quarter of adults in the UK are classed as inactive, costing the UK economy £20b per year. The evidence-base suggests that general physical inactivity contributes to health risks and as the Lancet reports, it is an important contributor to non-communicable diseases in countries (like England) of high income, and increasingly so in those of low and middle income 113. This can be made worse for people who have sedentary behaviour such as high sitting time whether due to work or because they watch a lot of TV or both. Sedentary behaviour is associated with increased risks of several chronic conditions and mortality. It is argued that high levels of moderate intensity PA (i.e., about 60–75 minutes per day) seem to eliminate the increased risk of death associated with high sitting time. However, this high activity level attenuates, but does not eliminate the increased risk associated sedentary behaviour 114.
The causes of disease and disability are complex, interrelated and interconnected. Physical inactivity (and sedentary behaviour) is in the top 10 to 4 attributable factors for the burden of disease and disability as well as poor mental health and well-being. PHE report that physical inactivity is the 4th leading risk factor for global mortality accounting for 6% of deaths globally (figure below). In the UK, physical inactivity is responsible for one in six (circa 17%) UK deaths with estimated costs to the UK of £7.4 billion annually (including £0.9 billion to the NHS alone) 115. It has been estimated that 37,000 deaths a year could be prevented in England if everyone met the CMO’s PA guidelines for adults (UK Active, 2014) 116. The rise of sedentary office jobs and the gig economy has not helped, contributing to people becoming less active.
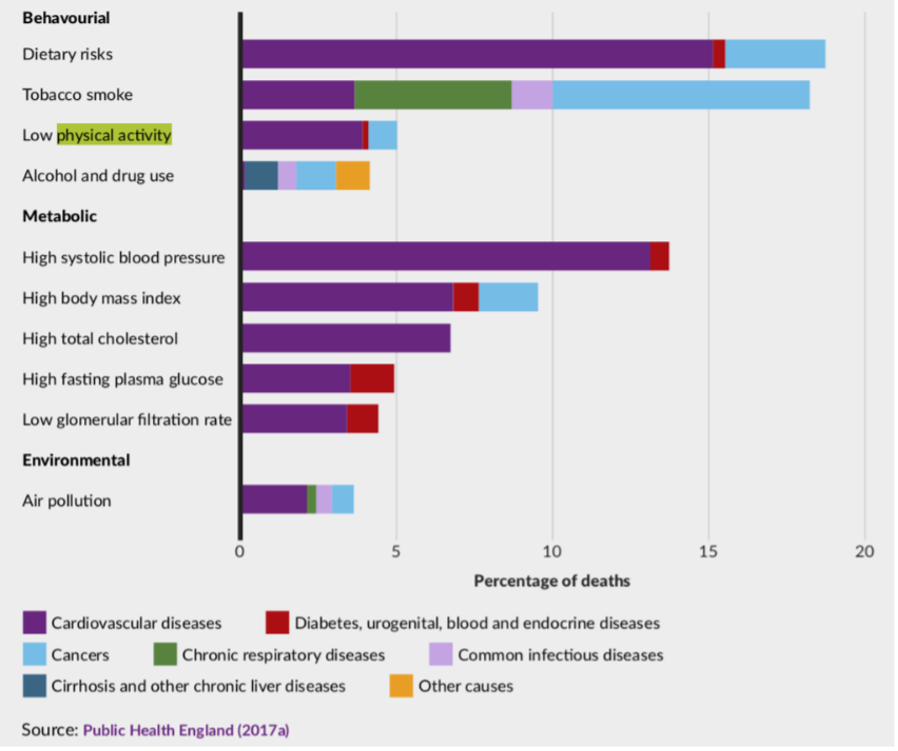
The Wandsworth premature mortality rate for under 75 years all causes is 167.9 per 100,000. The highest number of preventable deaths in Wandsworth are due to cancer deaths (70 per 100k or n=360), CVD (48.7 per 100,000 or n=236), respiratory conditions (16.1 per 100k or n=74) and liver disease (10 per 100k or n=29).
All these conditions can be affected by a number of health behaviours that when addressed can reduce such preventable mortality, such as tobacco use, unhealthy diet, insufficient physical activity and the harmful use of alcohol 117. Physical Inactivity is estimated as the principal cause for approximately 118:
- 21–25% of breast and colon cancer burden
- 27% of diabetes burden
- 30% of ischaemic heart disease burden
Risk Factors
It is also known that PA varies with age, tending to deteriorate as people get older 119 120. By the age of 75 years, only one in ten men and one in twenty women meet the recommended requirements for good health with respect to PA (Varney et al., 2014). 23% of Wandsworth population are aged 50 years and over and this is expected to grow.
Participation in exercising and other kinds of leisure is less common in socio-economically deprived communities. This may not hold true for all cases as there is a minority of individuals, it has been argued, from low socioeconomic groups who are actually more active , but the data shows that the majority in these groups tend to be inactive. The wider determinants of health can also affect levels of inactivity and the propensity to be physically active.
Regular PA helps to improve physical and mental functions as well as prevent or reverse the risks and some effects of chronic disease. In older people it also helps them keep more mobile and independent. That is why maintaining PA throughout the day, to avoid long periods of sitting or lying down is also important, particularly amongst older people who may engage less in being active or undertaking moderate or vigorous exercise.
Health Conditions Associated with Physical Activity
Prevalence information for disease and disability associated with physical inactivity are summarised in the table below, which includes National, London and Wandsworth data.
Source: OHID: Public Health Profiles
Across Life Course
London Sport reported in their Wandsworth Active Lives Borough Update 16/17 that by age bands those who have participated in sports at least twice in the last 28-days when surveyed are all higher than the London average across 16-34 years, 35-54 years, and 55-74 years age bands 121.
What the evidence says is that as people get older PA levels tend to fall. PHE say that the number of people aged 60 and over (currently 20% of the population) will rise to 24% by 2030, and in the next 20 years, the number of over 80-year-olds will treble. Although Wandsworth is one of the youngest populations in the country and has the highest number of adults aged 20-44 years in London; 23% of its population is 50 years and older. People aged 60 years and older constitute of 13% of the total population. Those aged 60-79 (33,986) are expected to rise by 25% by 2029 (42,624). The largest increase will be in people aged 80 years and older, 37% over the next decade.
Gender
Wandsworth gender split is 52% female and 48% male, and both are projected to increase by 13% each (circa 22,000) by 2029.
In terms of PA by gender there are some imbalances. Sport England Active Lives Survey 2016/17 reported that, “the proportion of females that were physically active in the last 28 days in the Borough has decreased by over 10%” 122. More recently, the Active Lives data (May 2018/2019) indicates that in Wandsworth there is a 4.9% difference between males and females reporting they are physically active; with males reporting at circa 81.6% and females at circa 76.7%.
Health data also shows better than national average health across the Borough, including lower obesity rates than London/ UK average, and a fairly low level of inactivity. In terms of inactivity, men in Wandsworth tend to be slightly more inactive (c.14.1%) compared to females (c. 13.4%). Furthermore, life expectancy is 6.3 years lower for men and 5.0 years lower for women in the most deprived areas of Wandsworth compared to the least deprived areas, and physical inactivity and sedentary behaviour is one of a complex set of contributing factors behind lower life expectancy.
Wandsworth has also found that men identified with a BMI of 30 or more in the main do not prefer to engage in weight lost programmes such as Slimmer’s World or Weight Watchers.
Ethnicity
The largest ethnic group in Wandsworth are those identifying as White British, with almost 1 in 3 identifies as Black, Asian and Minority Ethnic. Findings from Active Lives May 2018/2019 report show that in England, Mixed and White Other adults continue to have the highest activity levels, while Asian (excluding Chinese), Black and those with other ethnic origins are the least likely to be active. The Wandsworth ethnicity population is shown below. Wandsworth does not have the data to determine who in our ethnicity categories are physically active or inactive. If we assume England average applies to Wandsworth, then we would expect to see less PA and more inactivity amongst our Asian and Black groups and perhaps also Other groups.
Ethnicity Breakdown, 2023
In Wandsworth in 2025, 30.3% (n=108,207) of the total population were from BAME ethnic groups. The proportion of residents from BAME ethnic groups in the borough is 31.6% lower than the London average of 44.3%.
Source: © GLA 2016-based Demographic Projections, 2017
4.6 Barriers to Participation
A wide range of barriers can affect people’s participation in any type of PA. These need to be continually identified and addressed to enable more people to get physically active. Wandsworth Council has not yet carried out its own specific survey of its residents on the subject of barriers to PA. However, the Council’s Sports Team anecdotally hear that cost and time are the key barriers often quoted to them when they ask people as to why they do not increase their PA level. These are but two of a wide range and at times interconnected barriers our residents could face.
Current generic research in England looking at barriers to PA have found the following factors listed below (these barriers can have a disproportionate effect on people’s ability to become more physically active as per the CMOs recommended guidelines):
- Personal barriers such as a person’s own perception of their health or age (too old) or disability
- Fear of feeling embarrassed or having negative body consciousness
- Lack of motivation support for people with long-term conditions, mental health or learning disabilities
- Lack of energy – perceived or actual
- Discouragement as the idea of getting physically active to the recommend level feels too daunting especially coming from a place of inactivity. This barrier was identified in the recent evidence review of PA for disabled adults and the latest guidance now recognised that for older adults “some is good, more is better” as “any activity is better than none, and more is better still” 123.
- Lack of time – Too time poor as working long hours at work or due to shift patterns not coinciding with PA opportunities, and/or looking after their family
- Lack of motivation or interest, especially to start exercise from scratch
- Lack of peer support to encourage someone to get physically active
- A person may feel the benefit of PA does not outweigh the cost such as the pain and tiredness they feel or perceive
- Key barriers to walking according to Transport for London (TfL) were time constraints (most frequently cited reason for not walking more), followed by traffic levels being too high and cars travelling too fast. Other reasons were, personal security concerns, streets not being pedestrian friendly, a lack of fitness and having another preferred mode of travel are also common reasons given for not walking
- Key barriers to cycling according to TfL are fear of collisions, a perceived lack of fitness and a lack of confidence
- Isolation and loneliness can prevent people accessing options, especially without support or a companion
- Lack of support to enable a person to become physically active such as primary child carer or if they are a carer for someone to look after the person, they are taking care of so they can be free to exercise or become physically active
- Lack of awareness of what is on offer, the options, in their community
- Fear of injury or exacerbating a health issue, especially for those who are not regularly active, are disabled, have a health condition, are pregnant, or are older or frail
- Open Spaces either lacking or that are not developed or utilised appropriately and other barriers to participation such as not feeling safe (personal safety) or not easy to access or too far away or lack of toilet/ changing facilities
- Lack of transport or facilities nearby
- Limited active travel options
- Location, cost/ expense, and/or timing of physical activities such as sports or classes
- Internal barriers are perceived to be greater than external barriers to doing PA especially for people with long term conditions (LTCs).
- Perceptions of what sports or classes might be like such as will they make me too sweaty or too aggressive/ energetic or too loud (such as music), etc.
- Lack of certain activities of particular interest to men or women of certain faith groups (Muslim women’s preference for women only aerobics or swimming classes)
- Religious beliefs and associated cultural practices
- Bad weather
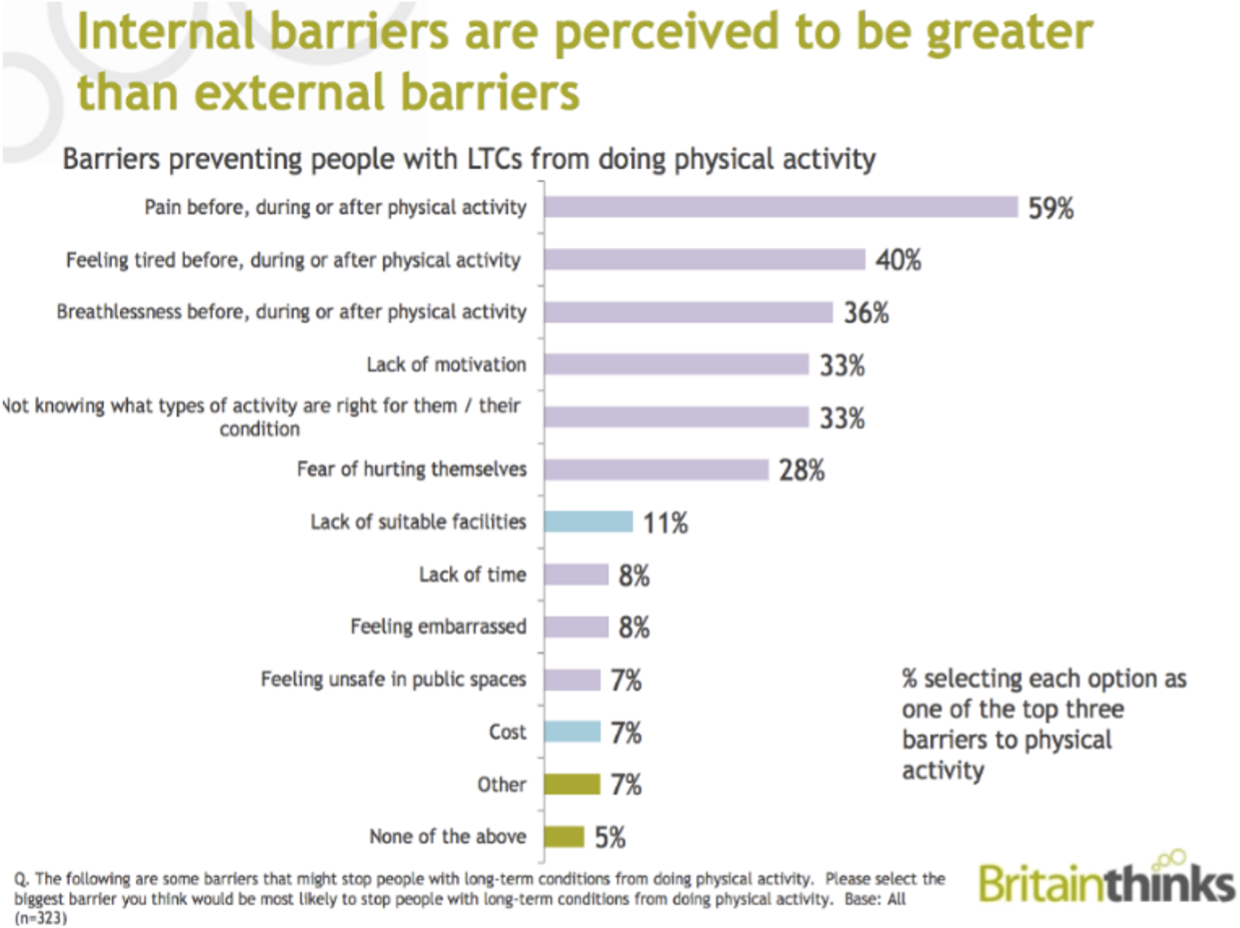
London Sport has identified seven different ‘less active’ segments. These are what people say prevent them becoming more physically active. These are outlined for Wandsworth below 124.
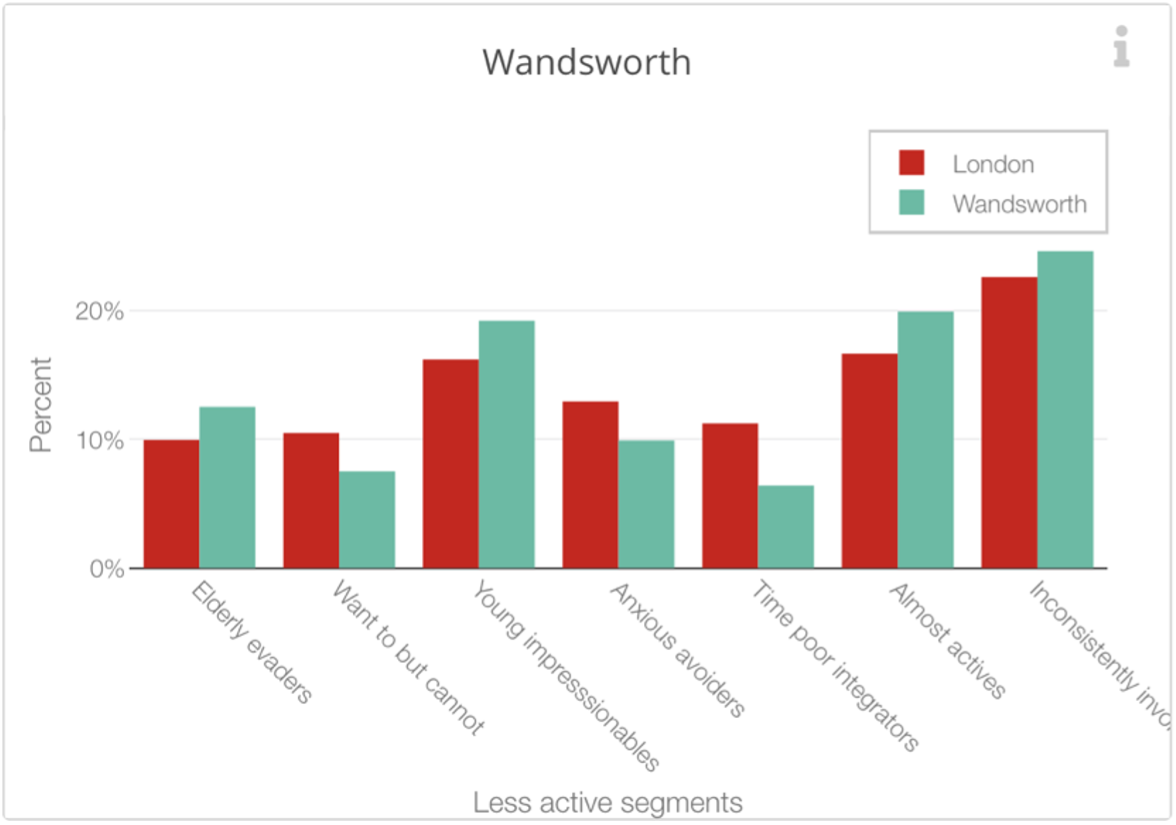
Source: London Sport.
Social Prescribing and other initiatives which offer people support to get physically active should help those individuals identify the barriers that affect them and provide mechanisms of support whether behavioural or physical (such a providing a befriender) to take them to their first activity.
Outdoor Spaces in Wandsworth
Wandsworth has the largest amount of green space within inner London with 32 different parks with 13 exercise places as of 2022. Public Health Profiles (2016) show that there was only 19.8% utilisation of outdoor space for exercise or health reasons. This is slightly higher than the London and England average of 18.0% and 17.9% respectively.
Barriers to the utilisation of green spaces were highlighted as cost of parking and lack of gym equipment in some parks.
4.7 Limitations to the Data/Information
Wandsworth has reported a good level of PA (73.3%) based on the Active Lives Survey (period May 2020/21). However, the limitations to this data are that they are all estimates based on a very small sample size. For example, the England total sample size in 2015/2016 was 198,911 and for Wandsworth 490. Whereas in the period May 2020/2021 it was 172,970 for England and Wandsworth it was only 551 respondents (In the period November 2018/2019 it was 181,535 for England and Wandsworth it was only 495 respondents). It has also been known, as noted earlier, that these types of surveys can be influenced by over-reporting or misunderstanding of what each category of intensity actually means in practice.
In the absence of ward level specific data in terms of PA or inactivity and other related data we have had to take Active Lives averages and estimates combined with findings from a literature review and the Active Wandsworth Strategy (2017-22), which incorporated a set of national and local guidance as identified above and apply these assumptions/ best practice to Wandsworth.
4.8 Current Services
Wandsworth Council has commissioned Enable Leisure and Culture to deliver the Councils Sports, Leisure and Parks Offer as well as to develop and deliver the Active Wandsworth Strategy 2017-22 that outlines what is on offer across the life course and how the PA offer and wider supporting system will develop in Wandsworth, including promoting and developing active travel in the Borough.
Wandsworth boasts numerous Sports and Gym Facilitates and Active Leisure and Culture Centres as well as parks and open spaces. Some parks have exercise equipment and outdoor gyms provided free to use, as well as several games areas for basketball, netball and 5-a-side football. The main commissioned services in Wandsworth supporting people to get physically active and eat more healthily in order to help them reduce their weight and live a better, healthier life with greater well-being are on a smaller scale, ‘Guys Get Fit’ two service offers’.
Guys Get Fit – Football or Circuits
Guys Get Fit offers two services. The first provides a 7 or more a-side football league for men who want to lose weight. The second is a circuit-based version instead of football to choose between. Theses 10-week courses are specifically for men with a BMI of 27 or more and costs £20, as it is subsidised by Wandsworth Council. Before each game players are weighed and the weight that has been lost is converted into goals on the scorecard in addition to those made on the pitch.
Guys Get Fit – Circuits Offer
This is very similar to football offer except football is instead replaced with a 10-week circuit training programme. This is based on Fit Fans. The programme aims to target men (aged 40-60 years) with a BMI equal to or greater than 25.
Get Active Roehampton and Wandsworth Get Active Roehampton Festival
Enable, Leisure and Culture, who receive external funding until the end of 2019/20 for their initiative, ‘Get Active Roehampton’. This initiative runs the Wandsworth Get Active Roehampton Festival. This showcased many of the activities available to residents to help them get physically active with free taster sessions. This programme also supports activities in Roehampton aimed at getting people physically active (helping those who need to lose weight) as well as improving their well-being but not specifically weight loss programmes. For example, yoga and Zumba classes in Roehampton and Get Out Get Active programme in Wandsworth. There are many varied classes. One of which offers sessions that cater for the older community of which half of the session is reminiscence therapy talking about sporting events as a vehicle for discussion followed by 45 minutes of light PA.
Wandsworth Exercise on Referral
The Exercise on Referral (EoR) Service offers support and advice from an Exercise Professional based at a Local Leisure Centre to a resident who has been referred to them by their General Practitioner (GP/ Doctor). This scheme is for people with specific health conditions. Its’ aim is to help the participant over a 12-week period to develop a personal programme that would:
- increase their personal confidence in the gym and fitness
- help them with any specific medical issues or conditions
5. Sexual Health and Contraception
5.1 Sexually transmitted Infections (STIs)
Sexual health is an important public health issue with health, social and economic impacts that can affect the population across the life course and is a fundamental aspect of human identity and life experience. Wandsworth adopts the World Health Organisation’s current working definition of sexual health which is described as: “a state of physical, mental and social well-being in relation to sexuality. It requires a positive and respectful approach to sexuality and sexual relationships, as well as the possibility of having pleasurable and safe sexual experiences, free of coercion, discrimination and violence” 125. Poor sexual health can lead to sexually transmitted infections (STIs), HIV and unintended pregnancies which can lead to further long-lasting and costly impacts for both individuals and wider society. However, they can be reduced through safer sex practices such as the use of condoms, regular testing and access to sexual health and reproductive services 126. Sexual health services currently focus on treatment for sexual health transmitted infections, HIV and unplanned pregnancies as well as prevention.
Improving the sexual health of Wandsworth residents is a priority because it not only contributes to reducing inequalities in health across the life course but can deliver savings to the wider health and social care economy. Preventing STIs, HIV and unwanted pregnancies is cost effective and evidence of return on investment is strong. For every pound spent on sexual health services, for example, £86 could be saved on future public spending 127 128 and every pound spent on contraception saves £11 in reduced healthcare costs <[Kings Fund (2014) Health Select Committee Inquiry into public expenditure on health and social care: evidence submission.].
Nationally deprivation and socio-economic status are associated with poorer sexual health. The association between poor sexual health and deprivation is seen in Wandsworth with those in quintile 1 (the most deprived) experiencing the poorest sexual health 129.
5.2 Sexual Health Indicators
National and local evidence clearly demonstrates that sexual health need varies according to factors such as age, gender, sexuality and ethnicity with inequalities in sexual health disproportionately affecting Black & Asian, Minority Ethnic (BAME) communities, those identifying as LGBTQ+, men who have sex with Men (MSM).
MSM are among the largest groups diagnosed with a new STI diagnosis and STI diagnosis is increasing among MSM. BAME communities in Wandsworth also experience a significantly higher proportion of STI diagnosis compared with the proportion of the population from ethnic groups. The age and gender distribution of new STI diagnoses (chlamydia, gonorrhoea, herpes, syphilis, warts) in Wandsworth residents in 2018 highlights that the largest number of newly diagnosed STI’s are in the 25 to 34-year-old age co-hort.
People identifying as LGBTQ+ can experience a greater degree of health inequalities, including sexual health 130. National data shows that where gender and sexual orientation are known, MSM account for 29% of London residents diagnosed with a new STI in a specialist health clinic; 90% of those diagnosed with syphilis and 63% of those diagnosed with gonorrhoea. In line with the national picture, the number of diagnosis of gonorrhoea and syphilis are higher in gay men compared to heterosexual men.
When comparing new diagnosis of STIs by ethnic origin and sexual orientation a larger proportion of white gay/lesbian are newly diagnosed.
Deprivation can further exacerbate poor sexual and reproductive health with those living in deprived areas most at risk of unintended pregnancy 131. Furthermore, unintended pregnancy can cause additional financial, housing and relationship pressures as well as having an impact on existing children 132. In Wandsworth, women accessing Emergency Hormonal Contraception (EHC) are more likely to live in more deprived areas of the borough and identify as Black, Asian or Minority Ethnic (BAME) group; further detail is provided within the Wandsworth Sexual Health Story 133.
The abortion rate is used as a proxy measure for unintended pregnancies. In Wandsworth in 2018 the total abortion rate stood at 16.8/1000 for 15 to 44-year olds. This is lower than that of both England and London, indicating women in Wandsworth have had good access to reproductive care over the last 6 years. However, more could be done as the percentage of conceptions leading to abortion has not changed since 2009 and has stood at 26%. The percentage of abortions performed under 10 weeks in Wandsworth, however, was 84.5% which is higher than both England (80.3%) and London (82.3%), indicating Wandsworth residents are getting swift access to abortion at an early stage. This trend has increased since 2012 when the percentage rate stood at 81%. 38% of all abortions were repeat abortions, 40% of which were repeat abortions in over 25s (ONS 2018).
The percentage of abortions performed under 10 weeks in Wandsworth, however, was 84.5% which is higher than both England (80.3%) and London (82.3%), indicating Wandsworth residents are getting swift access to abortion at an early stage. This trend has increased since 2012 when the percentage rate stood at 81%. 38% of all abortions were repeat abortions, 40% of which were repeat abortions in over 25s (ONS 2018).
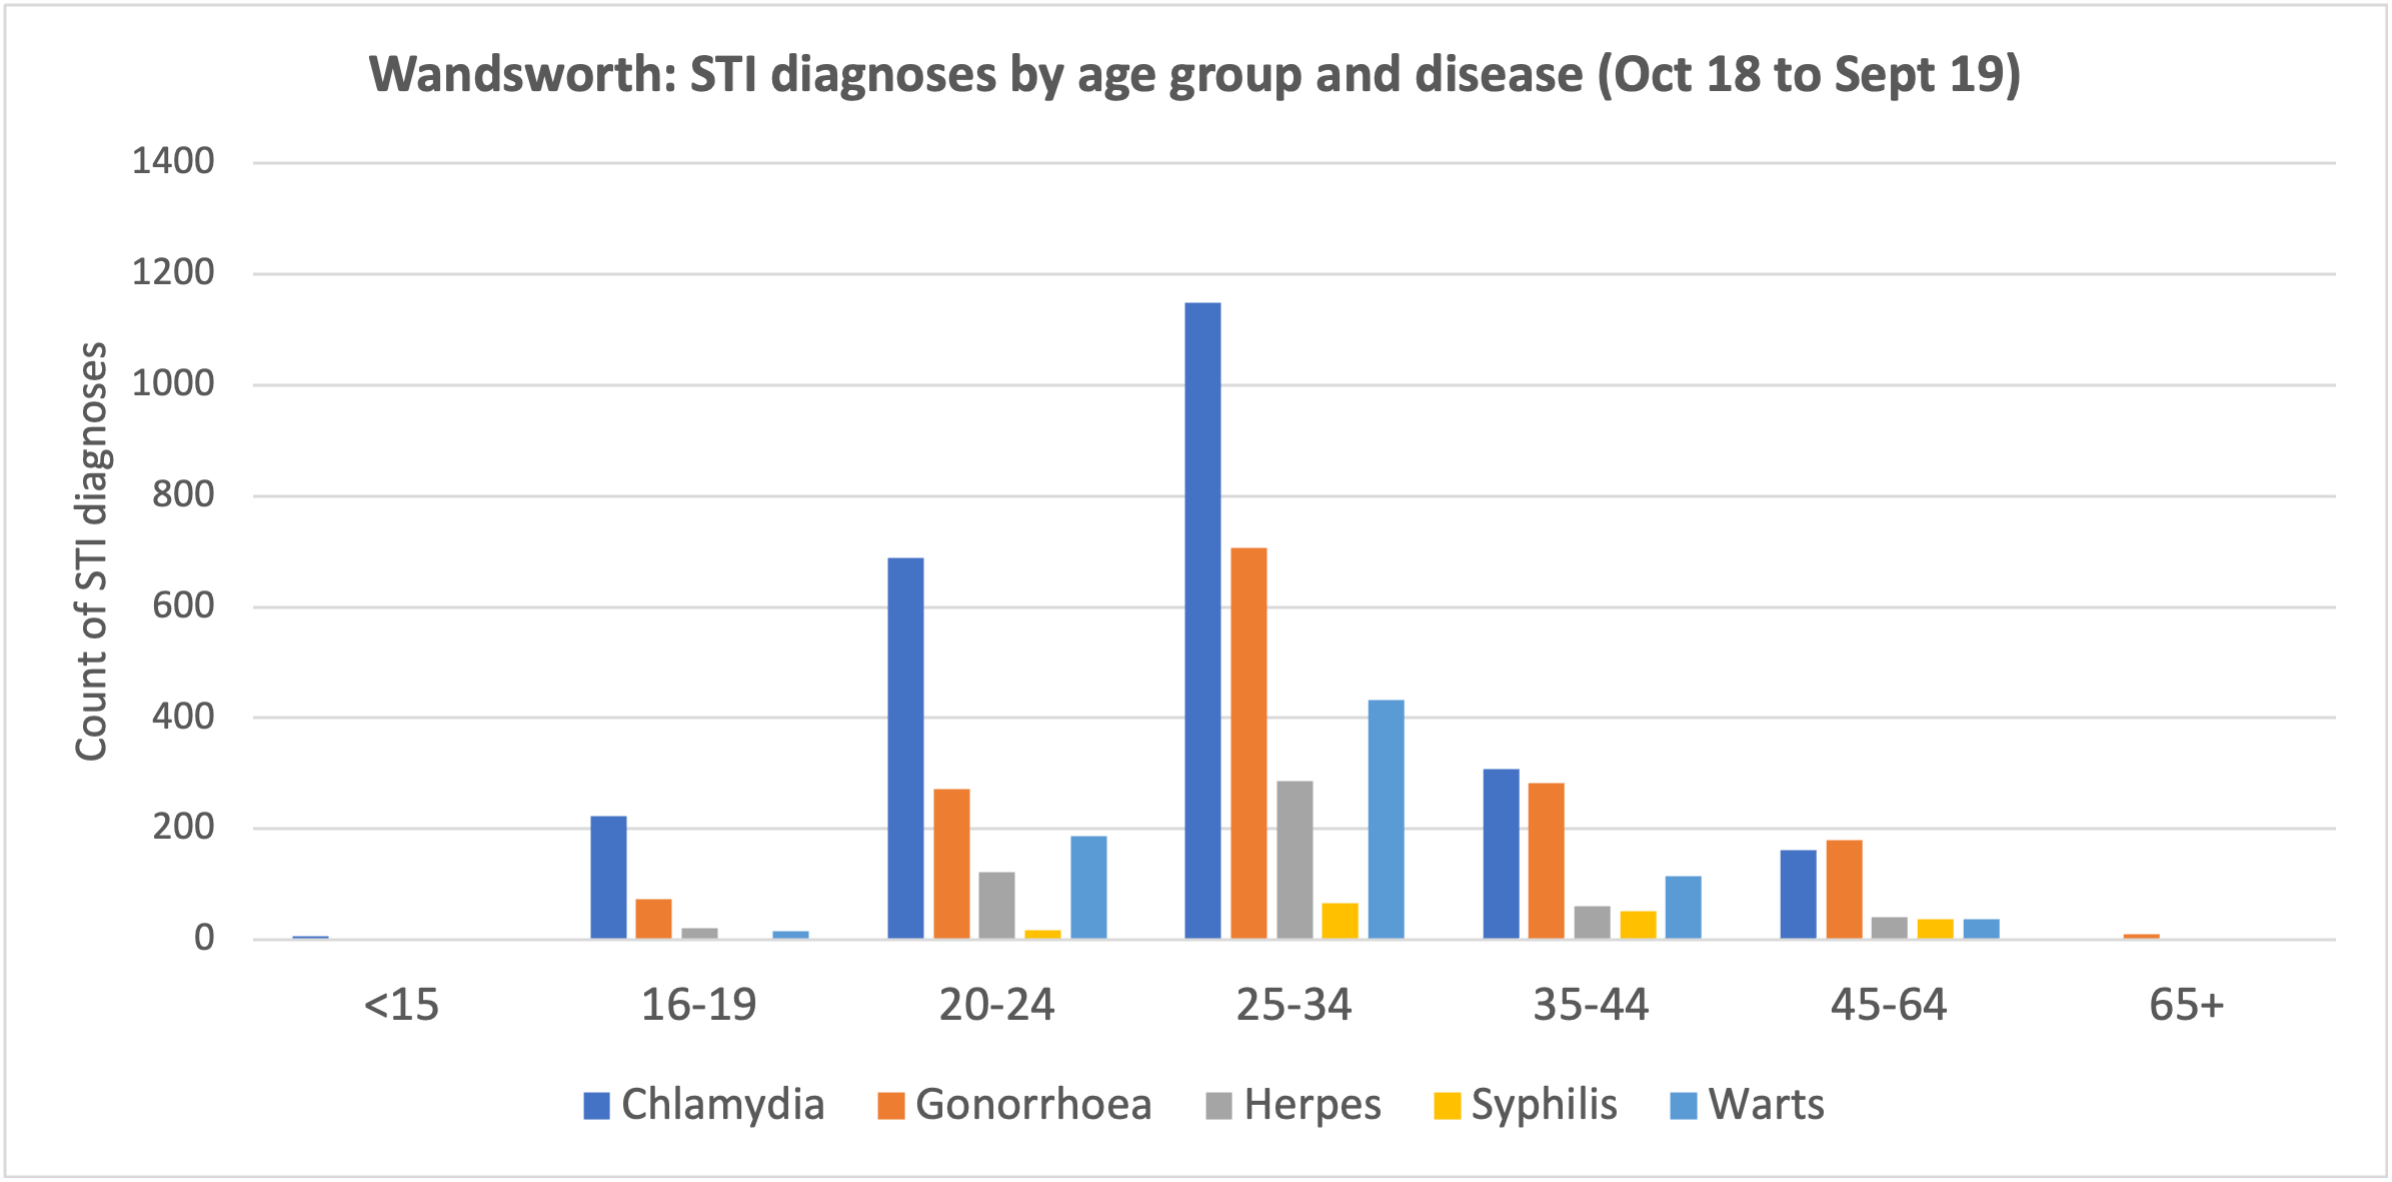
Source: GUMCAD Extracted Feb 2020
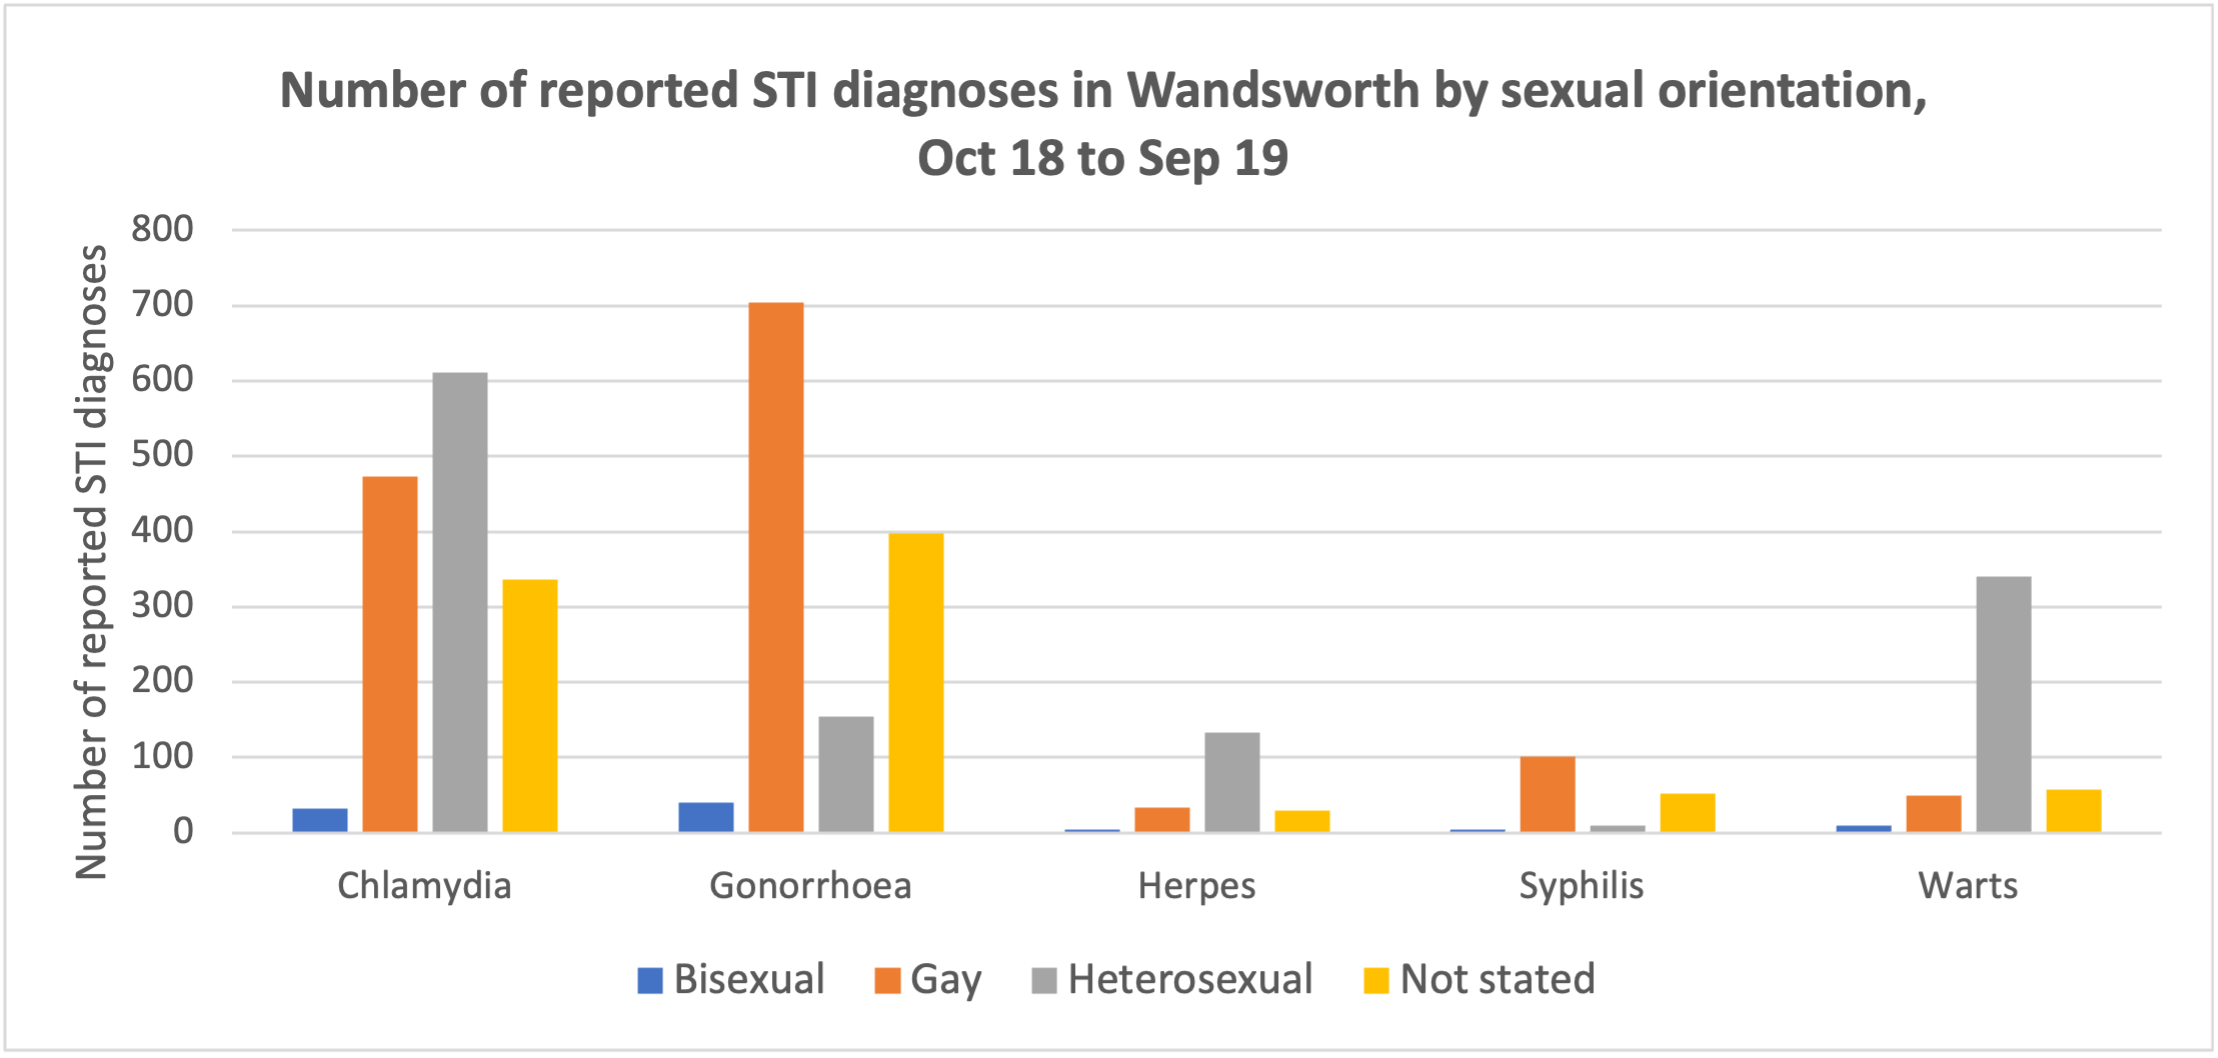
Source: GUMCAD Extracted Feb 2020
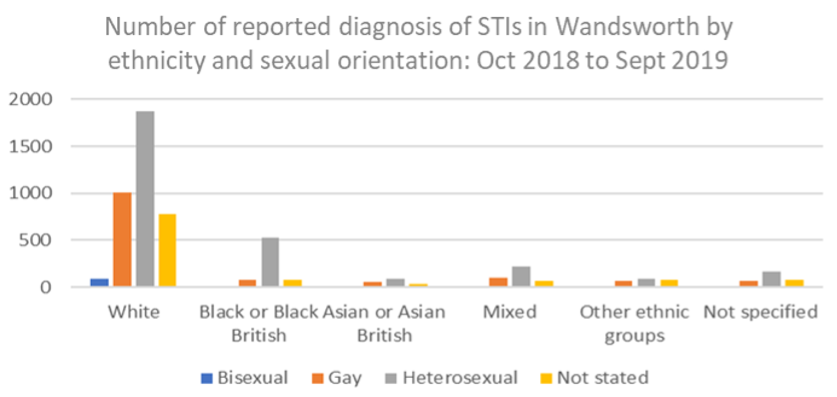
Source: GUMCAD Extracted Feb 2020
Level of Need
New STI diagnoses (excluding chlamydia aged 24 years and under) per 100,000: In 2024, Wandsworth’s rate was 1605.3 per 100,000 (n=5321), which was the 10th highest in London, 232.9% higher than the England average and 35.8% higher than the London average. The latest Borough figure for 2024 was also 6.2% higher than in 2012, in comparison with 15.1% decrease in England’s rate in the equivalent time period.
Source: OHID: Public Health Profiles
Source: OHID: Public Health Profiles
Genital Chlamydia Trachomatis is the most commonly reported bacterial STI in England. Infection is asymptomatic in at least 70% of women and 50% of men and as a result most infections remain undiagnosed 134. Untreated chlamydia infection has significant health consequences. It is associated with considerable reproductive morbidity in women including pelvic inflammatory disease, ectopic pregnancy and infertility. In men, complications can include urethritis, epididymitis and Reiter’s syndrome. The chlamydia detection rate is one of the Health Protection indicators within the Public Health Profiles (PHOF). In 2013 the department of Health set a recommended chlamydia detection rate of ≥2300 per 100.000 population as this indicates high volumes of screening and diagnosis.
Chlamydia Detection Rate
OHID recommends that Local Authorities work towards achieving a Chlamydia detection rate of above 2,300 per 100,000 population aged 15 to 24; the recommended level recommendation was set at a high level to encourage an increase in volume of screening and diagnoses. The PHE expectation is that increased level of screening is likely to result in a continued Chlamydia prevalence reduction.
Chlamydia detection rate per 100,000 aged 15 to 24 years: In 2024, Wandsworth’s rate was 1742.5 per 100,000 (n=653), which was the 7th highest in London, 39.4% higher than the England average and 19.6% higher than the London average. The latest Borough figure for 2024 was also 42.3% lower than in 2012, in comparison with 40.3% decrease in England’s rate in the equivalent time period.
Source: OHID: Public Health Profiles
Source: OHID: Public Health Profiles
Proportion of Females Aged 15-24 Screened for Chlamydia
Chlamydia proportion of females aged 15 to 24 years screened: In 2024, Wandsworth’s rate was 30.7% (n=6251), which was the 4th highest in London, 71.0% higher than the England average and 45.2% higher than the London average. The latest Borough figure for 2024 was also 25.7% lower than in 2021, in comparison with 15.1% decrease in England’s rate in the equivalent time period.
Source: OHID: Public Health Profiles
Source: OHID: Public Health Profiles
5.4 Abortion
Total abortion rate / 1000: In 2021, Wandsworth’s rate was 15.8 per 1,000 (n=1451), which was the 5th lowest in London, 17.7% lower than the England average and 24.4% lower than the London average. The latest Borough figure for 2021 was also 4.8% lower than in 2012, in comparison with 16.3% increase in England’s rate in the equivalent time period.
Source: OHID: Public Health Profiles
Source: OHID: Public Health Profiles
Abortions under 10 weeks (%): In 2021, Wandsworth’s rate was 90.2% (n=1255), which was the 3rd highest in London, 1.8% higher than the England average and 1.6% higher than the London average. The latest Borough figure for 2021 was also 11.1% higher than in 2012, in comparison with 14.3% increase in England’s rate in the equivalent time period.
Source: OHID: Public Health Profiles
Source: OHID: Public Health Profiles
5.6 Contraception
Long Acting Reversable Contraception (LARC) is known to be the most common form of effective contraception 135. LARC usage (excluding injections) in Wandsworth had seen an increase in recent years and in 2019 the rate exceeded 50 per 1,000 females. However COVID-19 pandemic resulted in a significant drop in LARC prescriptions.
Total prescribed LARC excluding injections rate / 1,000: In 2023, Wandsworth’s rate was 42.9 per 1,000 (n=4110), which was the 4th highest in London, 1.5% lower than the England average and 27.5% higher than the London average. The latest Borough figure for 2023 was also 16.0% higher than in 2014, in comparison with 13.2% decrease in England’s rate in the equivalent time period.
Source: OHID: Public Health Profiles
Source: OHID: Public Health Profiles
5.7 Current Services
Key messages from Public Health England on the detection, management and treatment of STIs suggest that approaches to promoting positive sexual health and reducing STI and HIV prevalence should include:
- The provision of open-access sexual health services providing rapid treatment and partner notification can reduce the risk of STI complications and the spread of infection.
- Focussing prevention, diagnosis, treatment and care of STIs on the general population as well as targeted groups.
- Continue to address the continued increase in syphilis diagnosis.
- Consistent and correct use of condoms to reduce STIs through condom distribution schemes.
- Annual testing for HIV and STIs for those not using condoms or sex with new or casual partners.
- Immunisation against hepatitis A and hepatitis B in MSM.
Wandsworth takes a joined-up approach to promoting positive sexual health and commissioning of sexual health services. Further detail is set out in the Wandsworth 2019 -2024 Sexual Health Strategy and corresponding Action Plan which set out the priorities and approaches for improving sexual health in the borough.
Sexual Health services are commissioned under the legal framework of the Health & Social Care Act 2012 and the subsequent transfer of public health responsibilities to local authorities in 2013. Local authorities therefore have a statutory duty to commission open access(Open access means that the local authority must pay for its residents wherever in the country they choose to access services), demand-led sexual health services, including contraception and testing and treatment of STIs. Open access services are therefore often, high demand and high volume in nature. In the first three quarters of 2019/20 the service recorded a footfall of 27680 patients attending clinics. From October 2018 to end Sept 2019 a total of 13718 patients with a recorded Wandsworth address attended the service.
Integrated sexual health and contraception services are delivered by Sexual Health South West London (CLCH) across Wandsworth, Richmond and Merton. Services, commissioned in line with national guidance 136 137, offer a hub and spoke service model including both walk in and booked appointments. Dedicated clinics are also offered for young people, women, and men who are gay, bisexual and have sex with men. Clients contact the service via a single point of access phone number and are triaged accordingly. The table below provides an overview of the services on offer through the integrated sexual health provision and other voluntary and community sector services.
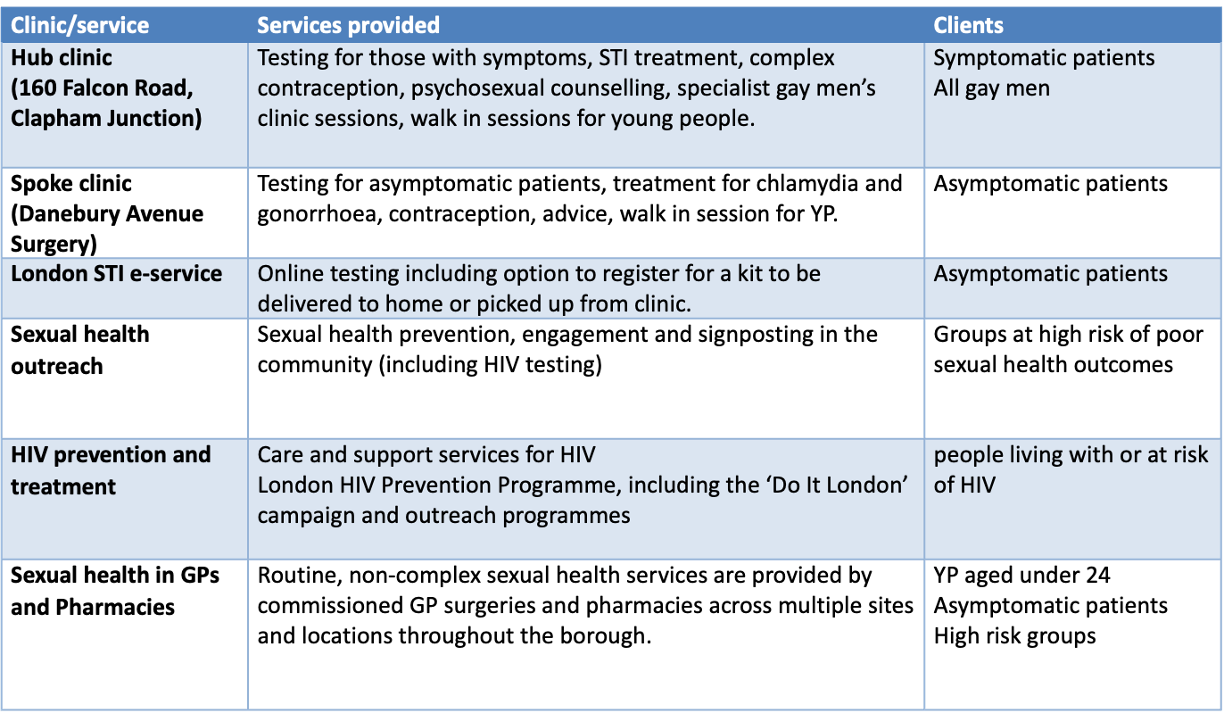
In Wandsworth there are 40 GP surgeries and 58 pharmacies contracted by the local authority to deliver sexual health services for residents. The services GP surgeries are contracted to deliver are chlamydia screening, HIV Point of Care Testing and Long Acting Reversible Contraception but are not offered universally across all GP surgeries. Pharmacies are contracted to deliver chlamydia screening and emergency contraception in line with Public Health England Pharmacy offer 138. Services are demand led. This means that service activity will not be consistent throughout the year and varies based on the needs of service users at any one time.
Public Health England recognises that community pharmacies are a health, social and a community asset having strong links to the diverse and vibrant communities they serve. Pharmacies play an important role in supporting people with sexual health, reproductive health and HIV. They are accessible to all especially deprived communities who may not access other conventional NHS services, helping to reduce health inequalities and the burden on existing providers139. Likewise, given the ongoing challenges, there remains a need for GPs to be able to manage patients swiftly, pragmatically and appropriately 140.
In total, there are 98 contracted providers in Wandsworth. The geographical distribution of providers ensures there is coverage at borough, locality and ward level. Residents are typically registered to a GP surgery local to their home address and PCNs operate to offer appointments between 8am and 8pm as well as at weekends. All residents are within 1,200m (3/4 mile) of a commissioned pharmacy and there is seven- day access across the borough. An analysis of sexual health services in primary care finds that sexual health activity in primary care is high, however a number of contractors are inactive and there is wide variation across services and providers with the majority being attributable to particular GP surgeries and pharmacies.
Contraception activity is high and increasing, including presentations for emergency contraception. Over half of GP surgeries delivered less than the NICE recommended minimum number of insertions required within a 12-month period. STI screening activity is decreasing, and the available resource is underused. The chlamydia detection rate is higher in pharmacies than GP surgeries although the EHC to chlamydia screening conversion rate in pharmacies is low.
More women than men are accessing sexual health services in primary care. The majority of service users are aged 39 or under and the BAME population is over-represented in comparison with the borough profile for age range.
The delivery of sexual health in primary care story recommends that sexual health services should continue to be provided in GP surgeries and pharmacies. However, commissioning from 2020 should consider the variation in service activity that exists between providers, including those that are inactive. Work to rationalise GP surgeries and pharmacies should be undertaken with services situated in areas where they are most needed, where demand is highest and provided by those who have demonstrated that they are best able and motivated to deliver services to residents consistently.
Actions should be taken to optimise the effectiveness of services including work to increase the detection of chlamydia and HIV and the total number of prescribed LARC in the borough. Ways to maximise the primary care offer for sexual health should be explored and suggestions are given. Commissioners and Public Health should consider and respond to the demographic characteristics of service users and the positive and negative drivers of the overrepresentation of particular groups. This includes differences in the demand and utilisation of services between male and female and BAME and White service users.
Commissioners should regularly assess the continually changing landscape seeking opportunities that may arise for service development and contractual delivery following the maturation of PCNs, the transformation of CCGs and implementation of the NHS Long-Term Plan.
Latest available data in respect of the above services demonstrates that by the end of quarter two (2019/20) Wandsworth had conducted over 5000 chlamydia screens, with a positivity rate of 6%. Both GP and pharmacy screens are steadily increasing and there are encouraging signs that on-line activity is beginning to grow, rising to 439 by the end of quarter two, with positivity increasing from 4.9% to 6.2%. Screening provided at sexual health clinics also rose from 688 in quarter one to 759 in quarter two with positivity rising at this site from 6.7% to 7.2%. E-service use from clinics rose from 1,308 screens and 4.5% positivity during quarter two to 1,362 tests and 5.2% positivity for quarter two. This provides good evidence to suggest that the channel shift form clinic to e-services is starting to take hold. This will in-turn reduce pressure on clinic times to allow more complex sexual health cases to be addressed within clinic.
In addition to accessing services at the local ISH service, borough residents can also choose to access sexual health service anywhere in the country. Latest available service data shows that there has been good and improving access to the variety of sexual health services offered across the borough. In Wandsworth from Oct 2018 to 19 over 55,500 people accessed a sexual health service for the first time. Access was greater amongst females who represented 59% of attendees 141.
6. Substance Misuse
The British Medical Association’s Scientific Board describes substance misuse as the use of a substance for a purpose that is not consistent with legal or medical guidelines. The substance in this definition includes synthetic or natural psychoactive substances. Substance use disorders are not only a risk to the physical and mental health of the individual; they also place strain on the community and its residents because substance misuse is often the root cause behind crime and social issues.
Psychoactive or psychotropic substances when ingested, smoked or injected affect the mental health, mood, cognition, sensation and behaviour. There are legal (licit) substances such as alcohol, tobacco and prescription drugs, and illegal (illicit) substances such as cocaine, and heroin. Typically, substance misuse involves the consumption of alcohol and illegal drugs, however other risky behaviours include addiction to prescription drugs, painkillers, illegal highs and ‘chemsex’. Except for alcohol, psychoactive substances are controlled by the Substance Misuse Act 1971. Harm also extends into the family and wider communities through domestic abuse, crime and burden on services. Substance misuse is a priority for the government and the Wandsworth Council to prevent health and social issues and improve community safety.
Substance misuse data for young people is included in the Start Well JSNA chapter.
Alcohol Use Disorders
The NHS defines alcohol misuse as drinking “in a way that’s harmful” or dependence on alcohol. And advises all adults not to regularly drink more than 14 units a week.
The country still responds to the 2012 National Alcohol Strategy which set out the following ambitions:
- A change in behaviour so that people think it is not acceptable to drink in ways that could cause harm to themselves or others
- A reduction in the amount of alcohol-fuelled violent crime
- A reduction in the number of adults drinking above the NHS guidelines
- A reduction in the number of people binge drinking
- A reduction in the number of alcohol related deaths
Drug Use Disorders
The World Health Organisation defines Substance Misuse as ‘the harmful or hazardous use of psychoactive substances, which can lead to dependence syndrome’. In the UK, the most common illicit drug is cannabis, followed by cocaine and ecstasy. Other drugs include painkillers, prescription drugs, illegal highs and drugs used for chemsex.
Drug possession, supply and production comes under criminal law in the UK. Drugs are classified into A, B, C and Temporary Class Drugs; the maximum penalties for drug possession, supply and production are dependent on the class of drug.
There is a National Drug Strategy from 2017 which focuses on reducing demand by universal and targeted preventative action, restricting supply by tackling criminal activity and building recovery by improving treatment quality.
A new Richmond and Wandsworth Substance Misuse Strategy is currently under development and is likely to take a three-pillar approach to tackling drugs and alcohol with ‘prevention and behaviour change, treatment and enforcement and regulation’. Each pillar is based on the age group with Start Well, Live Well, Age Well. The substance misuse strategy development links into other local authority strategies, including Children and Young People Need’s Assessment, Sexual Health Strategies, Homelessness, Community Safety, Corporate Plan.
6.1 Risk Factors Associated with Substance Misuse
Individual Risks
Substance use can increase the risk of short-term consequences to the individual with or without a substance use disorder. These include accidents and injury, violent and anti-social behaviour, unsafe sex, loss of personal possessions and alcohol poisoning which may result in unplanned time off work or education.
A substance use disorder can also have serious long-term health risks including increasing blood pressure, stroke, pancreatitis, liver disease, cancer, depression, dementia, sexual problems, mental / emotional health needs and infertility. Alcohol misuse is the biggest risk factor for death, poor health and disability among 15 – 49-year olds in the UK. There are also increased risks of social issues including family/relationship breakdown, unemployment, homelessness and legal or financial problems.
Public Health England estimate Wandsworth to have a higher number of alcohol dependant residents than the London or England averages (see levels of need below).
Risks to the Community
The prevalence of substance misuse disorders in an area can impact on community cohesion and safety. Violent crime can increase, in Wandsworth there are around 2,450 alcohol-related assaults per year distributed across the Borough’s five town centres. Alcohol use is a major factor in domestic violence with two thirds of domestic abuse incidents known to the police involving one or more person “under the influence”.
People who try illicit drugs are more likely than others to commit other forms of law-breaking. It is estimated that a minority of this group, approximately 100,000 people in the UK, finance their drug use through crime. The majority of those who steal to buy drugs were involved in crime before their drug use became a problem for them.
Substance use also have a heavy impact on services. In hospitals one in five patients have used alcohol harmfully and one in ten are alcohol dependent. In Wandsworth there are 5,100 admissions a year due to substance misuse. The Borough is principally served by St George’s Hospital, Tooting which accounts for approximately 60% of the alcohol and drug cases attending hospital, accounting for approximately 150 individuals per month. Chelsea and Westminster Hospital also sees Wandsworth service users, making up 20% of the hospital’s workload.
Barriers to Healthy Living
People with substance use disorders may have financial issues caused by their substance use that affect their ability to live in a healthy manner. For example, there are times when alcohol or drugs may be prioritised over food, clothing, health issues and housing. This can mean travel costs to attend health support or treatment services can be challenging.
Some people may live chaotic lifestyles, this may include lack of a long-term address or a distrust of professionals and persons in a position of authority (particularly when illegal drug use is involved) and timekeeping may be a problem. When someone is without a long-term address there may also be difficulties in getting a message to them, for example when arranging for an appointment.
People with substance use disorders may also face psychological barriers in accessing treatment and other services. This can be because of the stigma around substance use or from negative prior experience or low confidence/self-worth that can result in unwillingness to engage
Risk Factors
The population in Wandsworth is potentially at a greater risk of substance misuse. Firstly, the large transient population of young people who are more likely to use drugs recreationally in social settings such as nightclubs, bars and pubs. Furthermore, the long-standing population in Wandsworth has higher levels of deprivation; social and economic deprivation has been linked to higher rates of alcohol abuse.
Affordability of alcohol has significantly increased over time and is now 64% more affordable than it was in 1980.
Alcohol and substance misuse can affect all people regardless of age, gender, ethnicity. There are, however, a range of risk factors that can increase the likelihood of substance use disorder.
People who are being exploited, abused or assaulted, or who experienced exploitation, abuse or assault in their past, particularly in childhood may also be at greater risk of substance use disorders, as are those involved in commercial sex work or taking part in offending behaviour. Another risk factor is living in (or having grown up in) households where offending behaviour was part of the environment including where family members were imprisoned. Children or young people may be at greater risk of developing substance use disorders if they are looked-after children or care leavers.
In Wandsworth 19 out of every 10,000 children under 18 started to be looked after due to abuse or neglect, significantly higher than the London average of 13.
People who are exposed to substance use regularly can also be at risk. This can include people living in, or previously living in, households where others had problematic substance use. It can also include people living in deprived communities or those in transient populations. Other people also exposed to regular substance use include young people who are involved in the club or festival scene. Young people who identify as LGBTQ are identified as at particular risk because the LGBTQ scene has a close association with chemsex.
People who are homeless are also at risk of substance use disorders. Substance use disorders can be a causal factor in homelessness, and the street lifestyle is often substance use based which compounds the issue in this group. Wandsworth has 5.9 per 1,000 households who are classed as statutory homeless, this is the highest in London than the London average (4.2) and substantially higher than the England average (2.4)
Other risk factors include people who are not in employment, education or training; people who have mental or emotional health problems and people who have experienced a traumatic event or are living with high stress levels.
6.2 Population Prevalence and Need
Alcohol Use in Wandsworth
In England, there is estimated to be 589,000 dependent drinkers, of which less than 20% are receiving treatment. In Wandsworth it is estimated that there are 3,700 dependent drinkers (2014-15), 1.48% of the population. This is higher than the London (1.36%) and national (1.39%) averages. 43.9% of adults in Wandsworth drink over 14 units of alcohol a week, the highest percentage in London and more than double the London average of 21.8% (national average 25.7%).
Assuming no change in the proportions above, it is estimated that in 2020 there are 3,900 dependent drinkers in Wandsworth and 116,500 who drink over 14 units of alcohol a week (see table below).
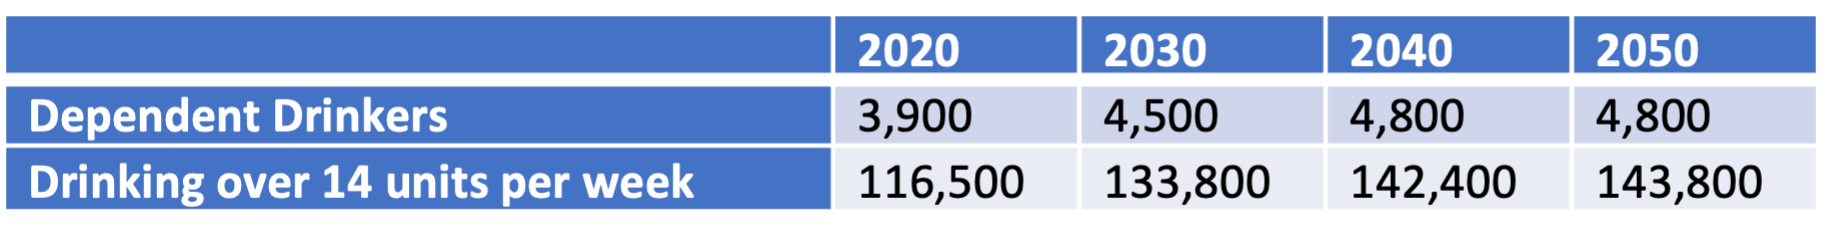
The Borough also has issues with street drinking, a mobile issue in the Borough, with seasonal pockets of activity in Battersea and Tooting in particular. Some of these are homeless while others may be housed but are involved in the street lifestyle.
Premises Licensed to Sell Alcohol
Premises licensed to sell alcohol per square kilometre: In 2023/24, Wandsworth’s rate was 34.4 nan (n=1177), which was the 10th highest in London, 2528.3% higher than the England average and 79.9% higher than the London average. The latest Borough figure for 2023/24 was also 19.0% higher than in 2015/16, in comparison with 10.3% increase in England’s rate in the equivalent time period.
Source: OHID: Public Health Profiles
Source: OHID: Public Health Profiles
Volume of Alcohol Sales
Volume of pure alcohol sold through the off-trade: all alcohol sales: In 2014, Wandsworth’s rate was 6.1 l/adult (n=1535456), which was the 3rd highest in London, 10.1% higher than the England average and 30.4% higher than the London average. Time series data were not available for this indicator.
Source: OHID: Public Health Profiles
Drug Use in Wandsworth
The 2018/19 Crime Survey of England and Wales found that around 3.2 million adults (16-59 years) took an illicit drug during 2018 and 2019 in England and Wales. Young people are more likely to take drugs than older people and men were twice as likely than women to take any drug in the last year. Drug use is linked to frequent visits to nightclubs, pubs and bars and among 16-24-year olds there has been an increase in the use of Class A drugs, driven by an increase in powder cocaine and ecstasy use.
The estimated prevalence of opiate and/or crack cocaine use in Wandsworth is 1,500 people (2016-17) and is a lower prevalence than the London and England averages (6.4 in Wandsworth, 9.3 in London, 8.9 in England). Assuming 6.4 people per 1,000 18+ residents is a consistent prevalence; the 2020 estimate would be 1,700 people.
The Borough sees around 900 service users in its community needle and syringe programme. Most of these individuals inject street heroin. However, there are numbers who frequent the chemsex scene and there are steroid users.
People in Treatment
Nationally the figures for the number of people in treatment programmes between 2009-10 and 2017-18 have reduced:
- Opiate presentations fell by 6%
- Non-opiate presentations fell by 4.5%
- Alcohol only presentations fell by 6%
- Non-opiate and alcohol presentations fell by 4%
Only 49% of people who start a treatment programme will complete it, with opiate users the least likely to complete at only 25%. The average time taken to complete a treatment programme for opiate use was nearly three years, for non-opiate drugs and/or alcohol the average time was under 32 weeks (7-8 months)
Analysis of the local cohorts against the general population demonstrated that:
- BAME – 76% of people using the current services are White
- Older adults are increasingly experiencing physical health morbidities related to drug and alcohol use
- Younger adults aged 18-24 were less well represented in the service which is predominated by those aged 35-59
Wandsworth drug treatment penetration rate (36%) is lower than in London (41%) and England (51%) meaning Wandsworth is treating proportionately fewer of its opiate and crack cocaine users than the London and England averages. There has been a decline in the age groups (18-44years) in drug treatment locally and in London. In Wandsworth, the greatest fall has been among 18- 24-year olds. From 2009/10 to 2012/13 there was a 42% fall in the number of drug treatment for this age group
In Wandsworth Children Specialist Services, for those children categorised as children in need, drugs & alcohol are highlighted as an issue for 9.6% (106/1093) of cases. The number is likely to be underestimated as drug or alcohol issues are often identified later in the assessment.
The existing service contract for people who have a substance use disorder in Wandsworth is shortly to come to the end of the contract and a new service is shortly to become active (see the table below for details). The proportional performance of the Borough since the start of the contract is outlined below with the representative change over the intervening period. The information is taken from the representative Diagnostic Outcomes Monitoring Executive Summary reports and is indicative only of overall current performance.

There have been no significant changes in the number of people in treatment during the period of the contract. Most of the individuals identified and treated by Borough services inject street heroin. It has been identified that there are a number of people engaging in ‘chemsex’ (table below).
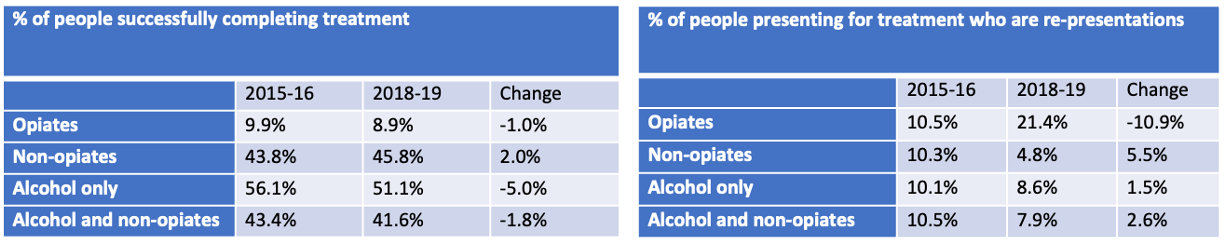
While the proportion of those completing treatment has remained relatively static within the margin of error, there has been a significant increase in re-presentations amongst opiate users.
Drug and Alcohol Related Deaths
Nationally, the number of people in treatment has fallen, however the number of deaths related to the use of drugs and alcohol has risen consistently since 2012. Although London experiences significantly fewer than the rest of the country.
The ONS made the following observations on drug deaths in England and Wales from drug use in 2017: * There were 3,756 deaths relating to drug poisoning in England and Wales in 2017, a rate of 66.1 deaths per 1 million population, and similar to levels seen in 2016 * Two-thirds of drug-related deaths were related to drug misuse, accounting for 43.7 deaths per 1 million in 2017 * Deaths involving cocaine and fentanyl continued to rise while deaths related to new psychoactive substances halved in 2017 For alcohol, deaths are split between alcohol specific and alcohol related deaths. ONS commented on alcohol specific deaths for 2017 as follows: * In 2017, there were 7,697 alcohol-specific deaths in the UK, an age-standardised rate of 12.2 deaths per 100,000 population, over double that of drug related deaths * For the UK, alcohol-specific death rates have increased in recent years to similar rates observed in 2008 where they were at the highest recorded * Since the beginning of the time series in 2001, rates of alcohol-specific deaths among males have been more than double those observed among females (16.8 and 8.0 deaths per 100,000 in 2017 respectively) * In 2017, alcohol-specific death rates were highest among 55- to 59-year-old females and 60- to 64-year-old males
In Wandsworth between February 2017 and January 2018 there were 25 deaths recorded related to drug and alcohol use. The table below shows the breakdown of causes:
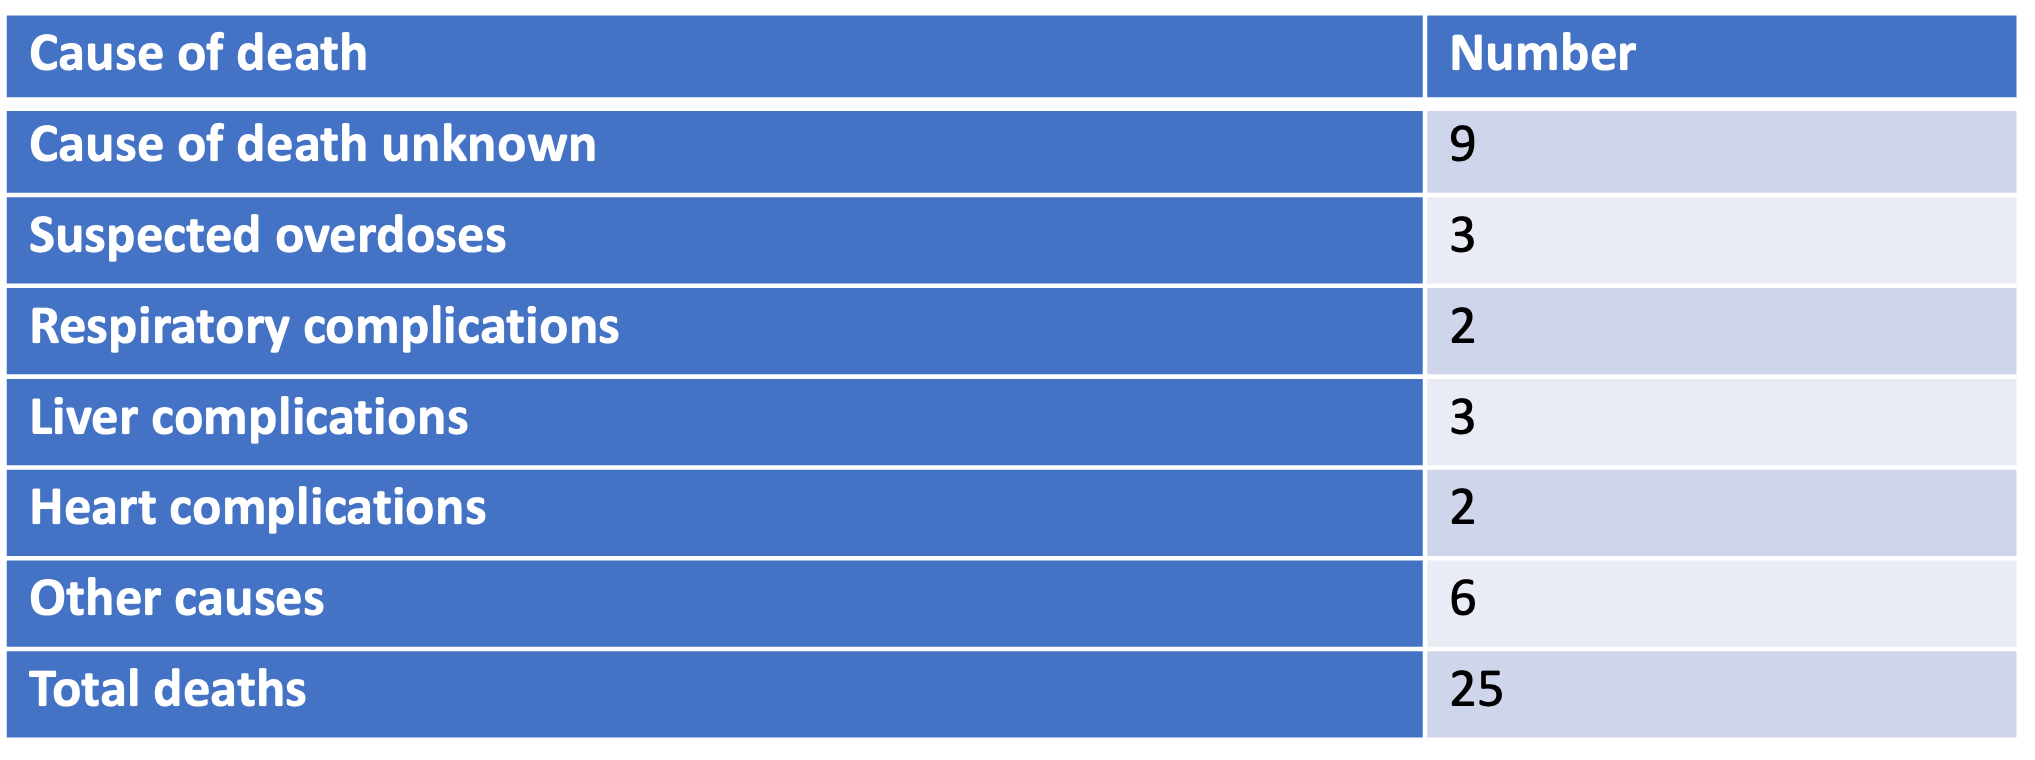
Drug and alcohol related deaths at the last record were 2.3 per 100,000. The Borough is experiencing greater numbers of deaths due to physical co-morbidities and end-of-life scenarios in ageing opiates and alcohol cohorts. The key challenge is to access underserved groups and meet the challenges posed by new drug taking activities.
There are a number of groups currently underserved and the new service has been tasked with developing appropriate interventions over the next 4 years. These groups are:
Women: Identified internationally as a significant and specific underserved group
BAME groups: The latest EINAs demonstrated that the current services are mainly accessed by white males
Younger adults: Services currently attract people in the age range 35 and upwards, who fit more traditional substance user profiles. This does not account for younger people who may purchase substances online whose using patterns do not fit those to which services are currently familiar
Older adults with physical co-morbidities: Some 50% of recent drug and alcohol deaths in the two Boroughs, where a cause of death is known, have been because of physical co-morbidities.
Co-occurring mental health and alcohol and drug use: In Wandsworth, there is a vibrant dual diagnosis group which has begun to coordinate service user needs with provider capacities and capabilities
Alcohol liaison with local hospitals: Work with hospital liaison teams to affect a reduction in the use of hospital services, focussing particularly on:
- Frequent attenders
- People admitted for stays of 3 days or longer
- People in receipt of ambulatory detoxification
Intellectual and development disabilities (including people with diagnosed Autistic Spectrum Disorders): Little evidence exists concerning the co-morbidity of substance use disorders and such disabilities. However, a cohort study from 2016, reported in BMJ Open, demonstrated that substance use disorders were prevalent in 6.4% of the group compared to only 3.5% of those without IDD
Suicide: Suicides are an increasing issue for Wandsworth and they have a significant impact within the deaths recorded as drug and alcohol
Limitations to the Data/Information
The key limitation is identification and managing the information. Aside from the visible homeless population, substance misuse can be difficult to identify.
Identification of the numbers of people with substance use disorders is not easy. Many feel a there is a stigma attached to substance use disorders, especially if it involves illegal substances, and are reluctant to engage with services. Prevalence rates are, therefore, estimates based on proxy measures.
6.3 Services on Offer
Wandsworth has a variety of services modelled around a consortium of four providers delivering pharmacological, psychosocial and Recovery Support Service (Volume 2 Service Specification).
The Borough has been well served by the previous contract with the system modelled around a consortium of three providers delivering pharmacological, psychosocial and recovery support services across community and criminal justice. The following services were also commissioned:
- A day programme predicated on co-production and partnership delivery principles
- Shared care across 12 general practices
- 44 active pharmacies providing supervised consumption, 11 of which also provide needle and syringe programmes
- A drug and alcohol liaison team at St Georges hospital in Tooting commissioned on behalf of the local CCGs
From April 2020 there is a new contract in place to expand and develop the previous services. Again, this is provided by a consortium of providers led by South London and Maudsley NHS Trust. The new service is designed around a progressive and innovative programme to deliver a strengths based service focussed on the needs of the individual to ensure:
- The reduction of harms to individuals, significant others and the general population
- A range of evidence-based interventions to support decision-making
- Achievement of intervention goals
The following key elements will be being developed and embedded over the next four years:
- Pharmacological interventions
- Psychosocial interventions
- Counselling and psychology
- Recovery support
- Online services and moderated communities
- Harm reduction services
- Low threshold support
- Aftercare and support
- Facilitated access to mutual aid
- Advice and support to deliver interventions to individuals who can self-direct care with support
- Training and information around identification and brief advice, signposting
- Cross-discipline use of resources to ensure good engagement with service users
- Health and nutrition and wellbeing including physical activity
Evidence Based Interventions/Approaches
Joint Working
Some of the joint working arrangements are not working as efficiently as possible and there may be people falling through the gaps.
Engagement in and successful completions from court requirements have fallen and the local Integrated Offender Management system, has poor uptake of court requirements for drug rehabilitation and alcohol treatment. Releases from Wandsworth prison rarely connect with local treatment services, with less than 15% successfully transferring to community treatment. The aspiration of the previous system was for flexibility to respond to changing presentations. This has not occurred on the scale envisaged or necessary to promote recovery. Work is required at both a strategic and operational level to improve these issues and custody interactions.
Liaison with the two main hospitals who treat Wandsworth residents (St Georges and Chelsea and Westminster) is not always seamless however it is improving. In addition, mental health connectivity is an issue, though some work is in progress between to establish joint working environments at the CMHT level.
Transition of young people from Looked After Children to care leavers is another area of vulnerability and the importance of partnership working with Children’s Services is imperative to effectively meet the needs of children engaging with risky behaviour. In general, younger adults are a group who are not adequately connected with. It is the view of commissioners that the previous services are not configured in a way that would be conducive to engagement.
Low threshold, early intervention services are key to enabling choice within potential service users.
The Model of Substance Use Disorder Service adapted from Rush 2008:
- Prevention and Early Intervention
- Brief Intervention
- Structured Community Intervention
- Complex need
GBD 2015 Risk Factors Collaborators. Global, regional, and national comparative risk assessment of 79 behavioural, environmental and occupational, and metabolic risks or clusters of risks, 1990–2015: a systematic analysis for the Global Burden of Disease Study 2015. Lancet, 2016; 388(10053):1659-1724↩︎
Joint Strategic Needs Assessment, Wandsworth (2018). The Wandsworth Joint Strategic Needs Assessment and Annual Report of the Director of Public Health 2017/2018. URL: https://www.datawand.info/wpcontent/uploads/2018/05/Wandsworth-JSNA-Annual-Summary-2017-18-Final.pdf↩︎
OHID Public Health Profiles (2022). Indicator: Smoking Prevalence in adults (18+) - current smokers (APS). URL: https://fingertips.phe.org.uk/search/smoking#page/4/gid/1/pat/6/par/E12000007/ati/102/are/E09000032/iid/92443/age/168/sex/4/cat/-1/ctp/-1/yrr/1/cid/4/tbm/1/page-options/car-do-0↩︎
OHID Public Health Profiles (2014/15). Indicator: Percentage of dependent drinkers. URL: https://fingertips.phe.org.uk/search/alcohol#page/6/gid/1/pat/6/par/E12000007/ati/102/are/E09000032/iid/93193/age/168/sex/4/cat/-1/ctp/-1/yrr/1/cid/4/tbm/1/page-options/car-do-0↩︎
D. Buck and F. Frosini, (2012) Clustering of health behaviours over time: implications for policy and practice, 2012. [Online]. URL: https://www.kingsfund.org.uk/insight-and-analysis/reports/clustering-unhealthy-behaviours-over-time↩︎
García, Jorge Luis, James J. Heckman, Duncan Ermini Leaf, and María José Prados. (2020) Quantifying the Life-Cycle Benefits of an Influential Early-Childhood Program. Journal of Political economy Volume 128, Number 7↩︎
OHID Public Health Profiles (2021/22). Indicator: Percentage of physically active children and young people. URL: https://fingertips.phe.org.uk/search/physical%20activity#page/4/gid/1/pat/6/par/E12000007/ati/102/are/E09000032/iid/93570/age/246/sex/4/cat/-1/ctp/-1/yrr/1/cid/4/tbm/1/page-options/car-do-0↩︎
© GLA 2021-based demographic projections. Housing-led population projections. Past Delivery 10-year migration, 2023. URL: https://data.london.gov.uk/dataset/housing-led-population-projections↩︎
OHID Public Health Profiles (2014/15). Indicator: Percentage of dependent drinkers. URL: https://fingertips.phe.org.uk/search/risky%20behaviours#page/3/gid/1/pat/6/par/E12000007/ati/102/are/E09000032/iid/91817/age/44/sex/4/cat/-1/ctp/-1/yrr/1/cid/4/tbm/1↩︎
© GLA 2021-based demographic projections. Housing-led population projections. Past Delivery 10-year migration, 2023. URL: https://data.london.gov.uk/dataset/housing-led-population-projections↩︎
NOMIS Census 2011 via DataWand, URL: https://www.datawand.info↩︎
J. N. Newton, A. D. Briggs, C. J. L. Murray, D. Dicker, K. J. Foreman and H. Wang, “Changes in health in England, with analysis by English regions and areas of deprivation, 1990-2013: a systematic analysis for the Global Burden of Disease Study 2013,” The Lancet, URL: https://www.thelancet.com/gbd, September 2015.↩︎
Public Health England: GBD Report (2020) The Burden of Disease in England compared with 22 peer countries : A report for NHS England URL: https://assets.publishing.service.gov.uk/government/uploads/system/uploads/attachment_data/file/856938/GBD_NHS_England_report.pdf↩︎
OHID Public Health Profiles. Indicator: Smoking Prevalence in adults (18+) - current smokers (APS). URL: https://fingertips.phe.org.uk/search/smoking#page/4/gid/1938132790/pat/6/par/E12000007/ati/102/are/E09000032/iid/92443/age/168/sex/4/cat/-1/ctp/-1/yrr/1/cid/4/tbm/1/page-options/car-do-0↩︎
OHID Public Health Profiles. Indicator: Percentage of dependent drinkers. URL: https://fingertips.phe.org.uk/search/alcohol#page/3/gid/1/pat/6/par/E12000007/ati/102/are/E09000032/iid/93193/age/168/sex/4/cat/-1/ctp/-1/yrr/1/cid/4/tbm/1↩︎
Public Health England (2020) The Burden of Disease in England compared with 22 peer countries : A report for NHS England URL: https://assets.publishing.service.gov.uk/government/uploads/system/uploads/attachment_data/file/856938/GBD_NHS_England_report.pdf (PDF)↩︎
OHID: 2019/20 Percentage of adults (aged 18+) classified as overweight or obese Public Health England (based on Active Lives survey, Sport England)↩︎
OHID Public Health Profiles. Indicator: Percentage of adults (aged 18 plus) classified as overweight or obese. URL: https://fingertips.phe.org.uk/search/obese#page/4/gid/1/pat/6/par/E12000007/ati/102/are/E09000032/iid/93088/age/168/sex/4/cat/-1/ctp/-1/yrr/1/cid/4/tbm/1/page-options/car-do-0↩︎
OHID Public Health Profiles. Indicator: Hypertension: QOF prevalence (all ages). URL: https://fingertips.phe.org.uk/search/hypertension#page/4/gid/1/pat/6/par/E12000007/ati/102/are/E09000032/iid/219/age/1/sex/4/cat/-1/ctp/-1/yrr/1/cid/4/tbm/1/page-options/car-do-0↩︎
Expected hypertension prevalence: PHE National Cardiovascular Intelligence Network. Adult hypertension prevalence estimates, 2017. Recorded prevalence: QOF 2017/18↩︎
29 Estimated prevalence of non-diabetic hyperglycaemia for adults aged 16 and over in England, National Cardiovascular Intelligence Network, Public Health England, 2015↩︎
Mayor of London. Cleaner Vehicles. 2019. URL: https://www.london.gov.uk/programmes-strategies/environment-and-climate-change/pollution-and-air-quality↩︎
Data.London. London Atmospheric Emissions 2016. Data used: 2016 URL: https://data.london.gov.uk/air-quality/↩︎
Public Health England (2020) The Burden of Disease in England compared with 22 peer countries : A report for NHS England, https://assets.publishing.service.gov.uk/government/uploads/system/uploads/attachment_data/file/856938/GBD_NHS_England_report.pdf (PDF)↩︎
DataWand. Deprivation reports. 2019. URL: https://www.datawand.info/deprivation/reports/↩︎
Nomis. Ethnic Group. 2011-2013. Data used: 2011-2013 URL: https://www.nomisweb.co.uk/query/construct/summary.asp?mode=construct&version=0&dataset=608↩︎
Data Wand. Custom Area Reporter – Custom Health Report. 2021. Data used: 2021 URL: https://www.datawand.info/custom-area-reporter/↩︎
ONS. Lower layer Super Output Area population estimates. 2019. Data used: 2018 Source: Index of Multiple Deprivation via Gov.uk, ONS population estimates (mid-2018) URL: https://www.ons.gov.uk/peoplepopulationandcommunity/populationandmigration/populationestimates/datasets/lowersuperoutputareamidyearpopulationestimates↩︎
DataWand. Children and Young People – Qualifications. 2021. URL: https://www.datawand.info/children-and-young-people/#/view-report/07853ccb32274062987962b7d4e602b3/___iaFirstFeature/G3↩︎
OHID Public Health Profiles. Smoking attributable mortality (new method). URL: https://fingertips.phe.org.uk/search/attributable#page/4/gid/1/pat/6/par/E12000007/ati/402/are/E09000032/iid/93748/age/202/sex/4/cat/-1/ctp/-1/yrr/3/cid/4/tbm/1/page-options/car-do-0↩︎
OHID Public Health Profiles. Smoking attributable hospital admissions (new method). This indicator uses new set of attributable fractions, and so differ from that originally published. URL: https://fingertips.phe.org.uk/search/attributable#page/4/gid/1938132885/pat/6/par/E12000007/ati/402/are/E09000032/iid/93753/age/202/sex/4/cat/-1/ctp/-1/yrr/1/cid/4/tbm/1/page-options/car-do-0↩︎
Action on Smoking and Health, Ready Reckoner Tool, accessed online, 2020. URL: https://ash.org.uk/↩︎
Action on Smoking and Health, Ready Reckoner Tool, accessed online, 2020. URL: https://ash.org.uk/↩︎
Action on Smoking and Health, Ready Reckoner Tool, accessed online, 2020. URL: https://ash.org.uk/↩︎
Action on Smoking and Health, Ready Reckoner Tool, accessed online, 2020. URL: https://ash.org.uk/↩︎
Action on Smoking and Health, Ready Reckoner Tool, accessed online, 2020. URL: https://ash.org.uk/↩︎
OHID Public Health Profiles. Smoking attributable mortality (new method). URL: https://fingertips.phe.org.uk/search/attributable#page/4/gid/1/pat/6/par/E12000007/ati/402/are/E09000032/iid/93748/age/202/sex/4/cat/-1/ctp/-1/yrr/3/cid/4/tbm/1/page-options/car-do-0↩︎
OHID Public Health Profiles. Smoking attributable mortality (new method). URL: https://fingertips.phe.org.uk/search/attributable#page/4/gid/1/pat/6/par/E12000007/ati/402/are/E09000032/iid/93748/age/202/sex/4/cat/-1/ctp/-1/yrr/3/cid/4/tbm/1/page-options/car-do-0↩︎
Action on Smoking and Health, Ready Reckoner Tool, accessed online, 2020. URL: https://ash.org.uk/↩︎
Towards a Smokefree Generation: a tobacco control plan for England, accessed online, 2020. URL: https://assets.publishing.service.gov.uk/government/uploads/system/uploads/attachment_data/file/630217/Towards_a_Smoke_free_Generation_-_A_Tobacco_Control_Plan_for_England_2017-2022__2_.pdf↩︎
Towards a Smokefree Generation: a tobacco control plan for England, accessed online, 2020. URL: https://assets.publishing.service.gov.uk/government/uploads/system/uploads/attachment_data/file/630217/Towards_a_Smoke_free_Generation_-_A_Tobacco_Control_Plan_for_England_2017-2022__2_.pdf↩︎
Towards a Smokefree Generation: a tobacco control plan for England, accessed online, 2020. URL: https://assets.publishing.service.gov.uk/government/uploads/system/uploads/attachment_data/file/630217/Towards_a_Smoke_free_Generation_-_A_Tobacco_Control_Plan_for_England_2017-2022__2_.pdf↩︎
Office for National Statistics, Adult smoking habits in the UK 2015. URL: https://www.ons.gov.uk/peoplepopulationandcommunity/healthandsocialcare/healthandlifeexpectancies/bulletins/adultsmokinghabitsingreatbritain/2015↩︎
Action on Smoking and Health, Ready Reckoner Tool, accessed online, 2020. URL: https://ash.org.uk/↩︎
Stroke Association. URL: https://www.stroke.org.uk/↩︎
Health Effects of Smoking. URL: https://www.cdc.gov/tobacco/data_statistics/fact_sheets/health_effects/effects_cig_smoking/↩︎
ASH Health Inequalities and Smoking. URL: https://ash.org.uk/uploads/ASH-Briefing_Health-Inequalities.pdf↩︎
E-cigarettes and heated tobacco products: evidence review. URL: https://www.gov.uk/government/publications/e-cigarettes-and-heated-tobacco-products-evidence-review↩︎
Waterpipe Smoking (Shisha) in England: the public health challenge, Associated of Directors of Public Health. URL: https://www.adph.org.uk/wp-content/uploads/2017/03/PHE-ADPH-Shisha-Report-February-2017-.pdf↩︎
Action on Smoking and Health, Ready Reckoner Tool. URL: https://ash.org.uk/↩︎
Action on Smoking and Health, Ready Reckoner Tool. URL: https://ash.org.uk/↩︎
Action on Smoking and Health, Ready Reckoner Tool. URL: https://ash.org.uk/↩︎
Tobacco Control Plan. URL: https://assets.publishing.service.gov.uk/government/uploads/system/uploads/attachment_data/file/714365/tobacco-control-delivery-plan-2017-to-2022.pdf↩︎
Health Matters: stopping smoking – what works. PHE. URL: https://www.gov.uk/government/publications/health-matters-stopping-smoking-what-works↩︎
Stop Smoking London. URL: https://stopsmokinglondon.com/↩︎
Catch22. URL: https://www.catch-22.org.uk/what-we-do/?gclid=EAIaIQobChMIiouQsszk7gIVl5ftCh0ojQY0EAAYASAAEgKulvD_BwE↩︎
Wandsworth Stop Smoking Service. URL: https://www.wandsworth.gov.uk/stopsmoking↩︎
OHID Public Health Profiles. Lung cancer registrations. URL: https://fingertips.phe.org.uk/search/lung%20cancer%20registration#page/6/gid/1/pat/6/par/E12000007/ati/302/are/E09000032/iid/1205/age/1/sex/4/cat/-1/ctp/-1/yrr/3/cid/4/tbm/1/page-options/car-do-0↩︎
URL: https://www.nhs.uk/live-well/eat-well/food-guidelines-and-food-labels/the-eatwell-guide/↩︎
URL: https://www.who.int/news-room/fact-sheets/detail/cancer↩︎
OHID. Public Health Profiles. Obesity Indicators. URL: https://fingertips.phe.org.uk/search/obesity/↩︎
Maternal and child nutrition public health guideline (PH11). URL: https://www.nice.org.uk/guidance/ph11/chapter/2-Public-health-need-and-practice↩︎
URL: https://www.alzheimers.org.uk/about-dementia/risk-factors-and-prevention/mediterranean-diet-and-dementia↩︎
URL: https://assets.publishing.service.gov.uk/government/uploads/system/uploads/attachment_data/file/699241/NDNS_results_years_7_and_8.pdf↩︎
Retail consortium data↩︎
London Environment Strategy↩︎
URL: https://digital.nhs.uk/data-and-information/publications/statistical/statistics-on-obesity-physical-activity-and-diet/statistics-on-obesity-physical-activity-and-diet-england-2019/part-6-diet↩︎
URL: https://www.gov.uk/government/publications/health-matters-preventing-type-2-diabetes/health-matters-preventing-type-2-diabetes↩︎
Carers UK Nutrition and Care Research briefing↩︎
URL: https://www.gov.uk/government/publications/obesity-weight-management-and-people-with-learning-disabilities/obesity-and-weight-management-for-people-with-learning-disabilities-guidance↩︎
URL: https://digital.nhs.uk/data-and-information/publications/statistical/statistics-on-obesity-physical-activity-and-diet/statistics-on-obesity-physical-activity-and-diet-england-2019/part-6-diet↩︎
Fraser, L.K., Clarke, G.P., Cade, J.E., & Edwards, K.L. (2012) Fast food and obesity: a spatial analysis in a large United Kingdom population of children aged 13–15. American journal of preventive medicine, 42 (5): e77-e85.↩︎
Adams, J., Goffe, L., Brown, T., Lake, A.A., Summerbell, C., White, M. & Adamson, A.J. (2015) Frequency and socio-demographic correlates of eating meals out and take-away meals at home: cross-sectional analysis of the UK national diet and nutrition survey, waves 1-4 (2008-12). International Journal of Behavioral Nutrition and Physical Activity, 12 (1): 51↩︎
URL: https://www.gov.uk/government/publications/food-statistics-pocketbook/food-statistics-in-your-pocket-summary↩︎
URL: http://researchbriefings.files.parliament.uk/documents/POST-PN-0522/POST-PN-0522.pdf↩︎
URL: https://www.gov.uk/government/publications/health-matters-obesity-and-the-food-environment/health-matters-obesity-and-the-food-environment--2#factors-behind-the-rise-in-obesity-levels↩︎
URL: https://academic.oup.com/nutritionreviews/article/73/9/594/1832837↩︎
URL: https://www.gov.uk/government/statistics/ndns-results-from-years-7-and-8-combined↩︎
URL: https://assets.publishing.service.gov.uk/government/uploads/system/uploads/attachment_data/file/445503/SACN_Carbohydrates_and_Health.pdf↩︎
URL: https://assets.publishing.service.gov.uk/government/uploads/system/uploads/attachment_data/file/699241/NDNS_results_years_7_and_8.pdf↩︎
URL: https://www.gov.uk/government/publications/health-matters-obesity-and-the-food-environment/health-matters-obesity-and-the-food-environment--2↩︎
URL: https://www.gov.uk/government/publications/health-matters-obesity-and-the-food-environment/health-matters-obesity-and-the-food-environment--2↩︎
URL: https://www.nutrition.org.uk/news/adherence-to-government-s-eatwell-guide-key-to-more-sustainable-diets/↩︎
URL: https://assets.publishing.service.gov.uk/government/uploads/system/uploads/attachment_data/file/287943/07-1469x-tackling-obesities-future-choices-summary.pdf↩︎
Bradley, J. The BMJ. URL: https://www.bmj.com/content/bmj/368/bmj.m4.full.pdf↩︎
Department of Health, Start Active, Stay Active: A Report on Physical Activity from the Four Home Countries’ Chief Medical Officers (2011). Page 10. URL: https://www.gov.uk/government/uploads/system/uploads/attachment_data/file/216370/dh_128210.pdf↩︎
OHID Guidance “Physical activity, applying All Our Health. URL: https://www.gov.uk/government/publications/physical-activity-applying-all-our-health/physical-activity-applying-all-our-health↩︎
Sport England, Active Lives Survey, period November 2018/19. URL: https://www.sportengland.org/know-your-audience/data/active-lives/active-lives-data-tables#adult_surveys↩︎
Sport England, October 2021. URL: https://www.sportengland.org/news/sport-and-physical-activity-must-be-used-level-and-tackle-inequalities↩︎
Sport England, Active Lives Survey, May 2020-21, Date Published 21st October 2021. URL: https://www.sportengland.org/know-your-audience/data/active-lives/active-lives-data-tables#adult_surveys↩︎
Chief medical officer. UK Chief Medical Officers’ Physical Activity Guidelines. URL: https://assets.publishing.service.gov.uk/government/uploads/system/uploads/attachment_data/file/832868/uk-chief-medical-officers-physical-activity-guidelines.pdf↩︎
Ding D, Lawson KD, Kolbe-Alexander TL, et al., Lancet Physical Activity Series 2 Executive Committee. “The economic burden of physical inactivity: a global analysis of major non-communicable diseases”. Lancet 2016; 388: 1311-24. doi:10.1016/S0140-6736(16)30383-X pmid:27475266. URL: https://www.bmj.com/content/366/bmj.l4570↩︎
Department of Health, Start Active, Stay Active: A Report on Physical Activity from the Four Home Countries’ Chief Medical Officers (2011). Page 10. URL: https://www.gov.uk/government/publications/physical-activity-guidelines-uk-chief-medical-officers-report↩︎
WHO. Global action plan on physical activity 2018–2030: more active people for a healthier world. URL: https://www.who.int/publications/i/item/9789241514187↩︎
Everybody active, every-day framework - An evidence-based approach to physical activity. URL: https://assets.publishing.service.gov.uk/government/uploads/system/uploads/attachment_data/file/374914/Framework_13.pdf↩︎
Physical activity: applying All Our Health. URL: https://www.gov.uk/government/publications/physical-activity-applying-all-our-health/physical-activity-applying-all-our-health↩︎
Physical activity: applying All Our Health. URL: https://www.gov.uk/government/publications/physical-activity-applying-all-our-health/physical-activity-applying-all-our-health↩︎
URL: https://assets.publishing.service.gov.uk/government/uploads/system/uploads/attachment_data/file/374914/Framework_13.pdf↩︎
Everybody active, every day: An evidence-based approach to physical activity, PHE, 2014; Page 7. URL: https://assets.publishing.service.gov.uk/government/uploads/system/uploads/attachment_data/file/374914/Framework_13.pdf↩︎
Department of Health, Start Active, Stay Active: A Report on Physical Activity from the Four Home Countries’ Chief Medical Officers (2011). URL: https://www.gov.uk/government/uploads/system/uploads/attachment_data/file/216370/dh_128210.pdf↩︎
Physical activity and mortality: what is the dose response and how big is the effect? URL: http://dx.doi.org/10.1136/bjsports-2019-101765↩︎
Dose-response curve for physical activity, Nigam, 2011↩︎
Correlates of physical activity: why are some people physically active and others not? Prof Adrian E Bauman (PhD), et al, The Lancet, series| physical activity| volume 380, 9838, P258-271, July 21, 2012. URL: https://www.sciencedirect.com/science/article/abs/pii/S0140673612607351↩︎
URL: https://www.sportengland.org/news/sport-and-physical-activity-must-be-used-level-and-tackle-inequalities↩︎
Wandsworth Active Lives Borough Update 16/17 – Sport England↩︎
URL: https://sportengland-production-files.s3.eu-west-2.amazonaws.com/s3fs-public/2020-04/Active%20Lives%20April%202020%20Tables%201-3%20Levels%20of%20Activity.xlsx?MGSfRKx5WR5Mr8kvLSx1b8QBqBhfjbDh↩︎
Correlates of physical activity: why are some people physically active and others not? Bauman et al,The Lancet, series| physical activity| volume 380, issue 9838, P258-271, JULY 21, 2012, URL: https://www.thelancet.com/journals/lancet/article/PIIS0140-6736(12)60735-1/abstract↩︎
Does physical activity attenuate, or even eliminate, the detrimental association of sitting time with mortality? A harmonised meta-analysis of data from more than 1 million men and women. Professor Ulf Ekelund (PhD), et al, The Lancet, 388, 10051, P1302-1310, SEPTEMBER 24, 2016, URL: https://doi.org/10.1016/S0140-6736(16)30370-1↩︎
Physical activity: applying All Our Health, Update October 2019, PHE. URL: https://www.gov.uk/government/publications/physical-activity-applying-all-our-health/physical-activity-applying-all-our-health↩︎
URL: https://www.ukactive.com/news/radical-overhaul-of-office-life-needed-to-save-nhs-claims-baroness-tanni-grey-thompson/↩︎
OHID. Mortality Profile. 2018. Data used: 2016-2018↩︎
Physical activity Factsheet, 2016↩︎
Stalsberg R, Pedersen AV. Are differences in physical activity across socioeconomic groups associated with choice of physical activity variables to report? Int. J. Environ Res Public Health 2018;15:1-23. 10.3390/ijerph15050922 29734745↩︎
Bradley, J. Thebmj. URL: https://www.bmj.com/content/bmj/368/bmj.m4.full.pdf↩︎
Wandsworth Active Lives Borough Update 16/17↩︎
Wandsworth Active Lives Borough Update 16/17↩︎
UK Chief Medical Officers’ Physical Activity Guidelines, 2019. URL: https://assets.publishing.service.gov.uk/government/uploads/system/uploads/attachment_data/file/832868/uk-chief-medical-officers-physical-activity-guidelines.pdf↩︎
London Sport. URL: https://data.londonsport.org/#31↩︎
WHO (2006) Defining sexual health: Report of a technical consultation on sexual health, 28-31 January 2002, Geneva↩︎
Department of Health (2001) The national strategy for sexual health and HIV.↩︎
Lucas, S. (2013) Unprotected nation: the financial and economic impacts of restricted contraceptive and sexual health services. Family Planning Association.↩︎
Lucas, S (2015) Unprotected Nation: An Update on the Financial and Economic Impacts of Restricted Contraceptive and Sexual Health Services. Family Planning Association.↩︎
Wandsworth Council (2018) Sexual health Needs Assessment.↩︎
Government Equalities Office (2018) LGBT Action plan 2018 – improving the lives of lesbian, gay, bisexual and transgender people.↩︎
OHID (2018) Health Matters: reproductive health and pregnancy planning.↩︎
Department of Health (2013) A framework for sexual health improvement in England.↩︎
Richmond and Wandsworth Councils (2020) The Delivery of Sexual Health in Primary Care, 2018-2019↩︎
Stamm W.E. Chlamydia trachomatis: progress and problems. Journal of Infectious Diseases. 1999; 179:S380-3.↩︎
National Institute for Health and Care Excellence (2005) Long acting reversible contraception. NICE guidelines CG30. October 2005.↩︎
Department of Health (2013) Commissioning Sexual Health services and interventions - Best practice guidance for local authorities↩︎
Public Health England (2015) Making it work: A guide to whole system commissioning for sexual health, reproductive health and HIV↩︎
Public Health England (2019) The pharmacy offer for sexual health, reproductive health and HIV: a resource for commissioners and providers↩︎
The Pharmacy Offer for Sexual Health, Reproductive Health and HIV A resource for commissioners and providers, Public Health England (2019), accessed online, available at The Pharmacy Offer for Sexual Health, Reproductive Health and HIV A resource for commissioners and providers.↩︎
Sexually Transmitted Infections in Primary Care 2013 (RCGP/BASHH) by Lazaro N. URL: www.rcgp.org and www.bashh.org/guidelines↩︎
GUMCAD (accessed Feb 2020), Wandsworth Patients attending all GUM and non-GUM services (Oct 18-Sept 19).↩︎
Social Prescribing
Green Social Prescribing
Green social prescribing is already operational in Wandsworth. There are a wide range of options available across SWL from conservation groups and outdoor exercise or sports clubs to groups with a more targeted mental health focus. Enable Leisure and Culture (ELC). ELC manage parks and open spaces on behalf of Wandsworth Council and hold the contract for Social Prescribing. Additionally, ELC have sports and wellbeing departments within the organisation that feed into both services.
ELC work closely with Thrive who use gardening to support the wellbeing of people living with disabilities or mental health conditions. Their hub is based at Battersea Park and they work alongside ELC and the grounds maintenance contractor to help maintain different parts Battersea Park.