JSNA Live Well - Long term conditions

Introduction

Chronic diseases (long term conditions) are the leading causes of death and disability worldwide. The World Health Organisation (WHO) acknowledges that rates of these conditions are accelerating and account for around 71% of deaths globally. Long term conditions are associated with modifiable behaviours and develop over a prolonged period of time, offering an opportunity for intervention. Cardiovascular disease, cancer, respiratory diseases and diabetes account for most of these deaths globally.

The WHO states the 5 main risks for developing non-communicable disease risks, all of which involve modifiable human behaviours, include:

  • Unhealthy diet: high in salt, sugar or unhealthy fats
  • Tobacco use
  • Air pollution
  • Harmful use of alcohol
  • Physical inactivity.

Unhealthy behaviours tend to cluster together creating multiple risk factors for poor health both in individuals and communities. However, to some degree they can be prevented, outcomes improved, and disease processes reversed with changes in lifestyle behaviour.

1. Adult Screening Programmes

1.1 Breast Cancer Screening

Cancer screening coverage: breast cancer: In 2023, Wandsworth’s rate was 54.2% (n=15522), which was the 16th lowest in London, 18.2% lower than the England average and 2.9% lower than the London average. The latest Borough figure for 2023 was also 14.2% lower than in 2010, in comparison with 13.9% decrease in England’s rate in the equivalent time period.

Source: OHID: Public Health Profiles

Source: OHID: Public Health Profiles

1.2 Cervical Cancer Screening

Cancer screening coverage: cervical cancer (aged 50 to 64 years old): In 2023, Wandsworth’s rate was 68.7% (n=19174), which was the 6th lowest in London, 7.7% lower than the England average and 2.8% lower than the London average. The latest Borough figure for 2023 was also 7.1% lower than in 2010, in comparison with 5.4% decrease in England’s rate in the equivalent time period.

Source: OHID: Public Health Profiles

Source: OHID: Public Health Profiles

1.3 Bowel Cancer Screening

Cancer screening coverage: bowel cancer: In 2023, Wandsworth’s rate was 63.7% (n=22638), which was the 15th highest in London, 11.6% lower than the England average and 0.3% higher than the London average. The latest Borough figure for 2023 was also 29.3% higher than in 2015, in comparison with 25.7% increase in England’s rate in the equivalent time period.

Source: OHID: Public Health Profiles

Source: OHID: Public Health Profiles

1.4 Other Adult Screening

Abdominal Aortic Aneurysm Screening

Abdominal Aortic Aneurysm Screening Coverage: In 2022/23, Wandsworth’s rate was 68.1% (n=840), which was the 6th lowest in London, 13.0% lower than the England average and 9.3% lower than the London average. The latest Borough figure for 2022/23 was also 24.7% higher than in 2021/22, in comparison with 11.5% increase in England’s rate in the equivalent time period.

Source: OHID: Public Health Profiles

Source: OHID: Public Health Profiles

Diabetic Eye Screening

In 2019, 68.7% of people with diabetes on GP registers had a record of retinal screening in the preceding 12 months 1. This is lower than London and England (73.7% and 77.3% respectively).

2. Cardiovascular Disease, CVD

This section explores the latest available Wandsworth-level information on prevention, prevalence, primary care management, hospitalisations, and mortality from cardiovascular conditions. The local coverage and outcomes of the NHS Health Checks, a programme for adults in England aged 40 to 74, is designed to spot early signs of stroke, kidney disease, heart disease, type 2 diabetes and dementia, included in this section. The NHS Health Check helps find ways to lower cardiovascular risk and has a clear role in delivering preventative and personalised solutions to ill-health, and empowering individuals to live healthier and more active lives

Cardiovascular disease (CVD) includes a group of diseases affecting the heart or blood vessels. The list of specific diseases within the CVD classification include coronary heart disease (CHD), myocardial infarction (heart attack), angina, coronary artery diseases and stroke. Primary prevention of CVD requires patients at risk are identified before disease has become established. People with hypertension are at high risk of developing CVD. Controlling blood pressure is therefore a significant factor that protects the patient from developing serious circulatory conditions.

2.1 Prevention - The NHS Health Checks Programme

The NHS Health Checks Programme is a mandated service under the Health and Social Care Act 2012. Local Authorities have a legal duty to invite 100% of its eligible population over a 5-year period and deliver at least 50% NHS Health Checks. The annual local targets translate to 20% invitations and 10% NHS Health Checks. The programme is a systematic vascular risk assessment and management programme, aiming to reduce the incidence of heart disease, stroke, diabetes and kidney disease. It is also an opportunity to identify dementia across the population, particularly high risk and vulnerable groups. It helps people to take action to avoid, reduce or manage their risk of developing these conditions It also contributes to the objectives of tackling health inequalities, including socio-economic, ethnic and gender differences.

Office for Health Improvement & Disparities estimates the NHS Health Check Programme could, on average, prevent 1,600 heart attacks and strokes, and save at least 650 lives each year. The programme aims to prevent over 4,000 people a year from developing diabetes, detect at least 20,000 cases of diabetes or kidney disease earlier, allowing individuals to be better managed and improve their quality of life. It achieves this by assessing the top seven risk factors driving the burden of non- communicable disease in England and by providing individuals with behavioural support and, where appropriate, pharmacological treatment.

NHS Health Checks logo

Aims and Delivery Model

For Wandsworth, the NHS Health Checks Programme aims to improve health outcomes and quality of life of residents. It does this by identifying individuals at an earlier stage of vascular change and provide opportunities to encourage them to substantially reduce their risk of CVD morbidity or mortality. All 40 Wandsworth GP Practices provide NHS Health Checks, giving good geographical coverage across Wandsworth. GPs can prioritise invitations for people identified with a high predicted CVD risk score (based on QRISK prediction). As the number of NHS Health Checks increase during 2021-22 towards pre-COVID levels, the Public Health Division will explore adopting a proportionate universalism approach. The service will remain available to all eligible residents, groups and communities at increased risk of CVD and related illnesses. Those who may be disproportionately affected by COVID are prioritised for a health check.

During 2019/20, Wandsworth exceeded its annual target to invite 20% of the eligible population for an NHS Health Check; 16,279 patients were invited, and 6,733 eligible Wandsworth residents received a Health Check.

Of those 6,733 who received an NHS Health Check in 2019-20:

  • 3,757 (55.8%) 40-50 years
  • 2,168 (32.2%) 51-60 years
  • 1,104 (16.4%) 61-74 years
  • 3,737 (55.5%) female
  • 2,996 (44.5%) male
  • 2,114 (31.4%) BAME
  • 2,208 (32.8%) of attendees were recall patients, post five-years
  • 263 (3.9%) registered to addresses in the most deprived areas of the Borough 2
  • 1,145 (17%) not resident in the Borough but registered with a Wandsworth GP.

According to the data, 55.5% of service users were female. This shows that women are more likely to attend the health checks service than men. Females account for 49.3% of the borough profile. People aged 40-50 years are the highest age group (55.8%), followed by people aged 51-60 years check post five-years.

32.8% of service users were BAME; the proportion was smaller when compared to the percentage of borough BAME population within 40-74 age range (34.7%). 3.9% were registered to addresses in the 20% most deprived areas of the Borough compared to the borough profile at 4.5%. 17% of patients registered with a Wandsworth GP do not live in the Borough.

NHS Health Checks Outcomes

During 2019/20, from the 6,733 patients who received a Health Check, outcomes included:

  • 22 residents were identified with a high QRISK score (>20%)
  • 243 residents were identified as having high blood pressure
  • 232 residents were diagnosed hypertensive
  • 6 patients diagnosed with stage 3 or higher chronic kidney disease (CKD)
  • 3,747 patients were classified as obese (BMI > 30kgm2)
  • 808 were identified with a Q-Diabetes score greater than 5.6%
  • 98 residents were diagnosed Type 2 Diabetic.

Referrals from an NHS Health Check to lifestyle support services during 2019/20 included:

  • 57 patients were referred to the National Diabetes Prevention Programme (NDPP), 19 people (25%) declined
  • 192 people were referred to the Exercise on Referral Programme, 221 people (54%) declined
  • 113 patients were referred to Weight Management Programme, 126 people (53%)declined
  • 93 patients were referred to Smoking Cessation Services 53 people (36%) patients declined.

Cumulative percentage of the eligible population aged 40 to 74 offered an NHS Health Check: In 2018/19 - 22/23, Wandsworth’s rate was 82.3% (n=65290), which was the 12th highest in London, 27.3% higher than the England average and 16.4% higher than the London average. The latest Borough figure for 2018/19 - 22/23 was also 37.8% lower than in 2013/14 - 17/18, in comparison with 28.8% decrease in England’s rate in the equivalent time period.

Source: OHID: Public Health Profiles

Source: OHID: Public Health Profiles

Cumulative percentage of the eligible population aged 40 to 74 offered an NHS Health Check who received an NHS Health Check: In 2018/19 - 22/23, Wandsworth’s rate was 46.4% (n=30284), which was the 15th lowest in London, 9.7% higher than the England average and 3.8% lower than the London average. The latest Borough figure for 2018/19 - 22/23 was also 11.2% lower than in 2013/14 - 17/18, in comparison with 13.2% decrease in England’s rate in the equivalent time period.

Source: OHID: Public Health Profiles

Source: OHID: Public Health Profiles

Cumulative percentage of the eligible population aged 40 to 74 who received an NHS Health check: In 2018/19 - 22/23, Wandsworth’s rate was 38.2% (n=30284), which was the 13th highest in London, 39.6% higher than the England average and 12.0% higher than the London average. The latest Borough figure for 2018/19 - 22/23 was also 44.8% lower than in 2013/14 - 17/18, in comparison with 38.2% decrease in England’s rate in the equivalent time period.

Source: OHID: Public Health Profiles

Source: OHID: Public Health Profiles

Diabetes Identification Through the NHS Health Check

In 2019/20, Wandsworth completed 6,602 NHS Health Checks; blood test results showed that 58 people had an HbA1c result in the diabetic range 3. Nationally, it is estimated that NHS Health Checks could prevent 4,000 people a year from developing diabetes 4. For every 80 – 200 NHS Health Checks, one person is diagnosed with Type 2 Diabetes (0.5%–1.25% of checks) 5. Wandsworth was within this range with 0.87% of checks resulting with a diabetes diagnosis.

In 2019/20, 4,951 (75%) of people having an NHS Health Check had an HbA1c result recorded, and of these 326 (6.6%) had an HbA1c reading in the non-diabetic hyperglycemia (NDH), 5% of all NHS Health Checks. Thirty percent of people had a QDiabetes score greater than 5.6, indicating they are at high risk of Type 2 Diabetes. 23% of people within this group did not have an HbA1c result recorded. A further 5% of people did not have a QDiabetes or HbA1c result recorded. This shows missed opportunities for NDH identification and early intervention (see the figure below 6).

NDH Identification through NHS Health Checks, 2019/20.

2.2 Diabetes

Diabetes is a condition where the amount of glucose (a type of sugar) in the blood is too high. There are many types of diabetes including Type 1, Type 2, gestational, and other rarer types of diabetes. Type 1 Diabetes accounts for around 8% of cases, other rarer types of diabetes accounts for 2%, and Type 2 Diabetes accounts for 90%.

Type 1 Diabetes develops when the body is unable to produce insulin. Type 2 Diabetes develops when the body stops producing enough insulin, or the body’s cells stop reacting to the insulin produced. This means sugar builds up in the blood and cannot get into the cells of the body where it is used for fuel.

This section focuses on Type 2 Diabetes as it is associated with lifestyle factors and can be delayed or prevented. The other types of diabetes, such as Type 1 Diabetes, are not related to lifestyle issues and cannot be prevented. There are various terms used for describing the high risks for developing Type 2 Diabetes including:

  • pre-diabetes
  • borderline diabetes
  • impaired fasting glucose (IFG)
  • impaired glucose tolerance (IGT)
  • impaired glucose regulation (IGR)
  • non-diabetic hyperglycaemia (NDH).

NDH will be used throughout this section to mean high risk of Type 2 Diabetes.

Once people know they are at risk, they can often prevent or delay Type 2 Diabetes by making healthy changes to their diet and lifestyle. Without lifestyle changes, people with NDH are very likely to progress to Type 2 Diabetes. Eating healthy foods, incorporating physical activity in daily routines, and maintaining a healthy weight can help bring blood sugar levels back to normal.

Prevalence of non-diabetic hyperglycemia A blood test which detects the level of glucose in blood is needed to make the diagnosis of NDH and Type 2 Diabetes. An HbA1c blood test is often used and gives an average of how high the blood glucose levels have been over the preceding few months.

NDH is defined as an HBA1c value between 6.0% (42mmol/mol) and 6.4% (47mmol/mol), excluding those who had already been diagnosed with diabetes with an HBA1c value in this range. An HbA1c value of 6.5% (48 mmol/mol) or above, is recommended as the blood level for diagnosing diabetes. A value of less than 48mmol/mol (6.5%) does not exclude diabetes from being diagnosed using glucose tests.

The number of people developing Type 2 Diabetes has been increasing globally 7. This is largely due to the rise in obesity, which is estimated to account for 80-85% of all Type 2 Diabetes cases in the UK8. Being overweight or obese is the major modifiable risk factor for Type 2 Diabetes.

The figure below 9 provides the demographic breakdown of registered people in Wandsworth with NDH by GP Practice. At individual GP practice level, the percent of people identified with NDH varies, ranging from around 0.2% to 6%. NDH prevalence by age, sex, deprivation and ethnicity:

  • males and females have a similar percent of people registered with NDH
  • NDH prevalence varies with age. The 40-64 years age group has the highest percent of people registered with NDH, followed by the 65-79 years age group
  • NDH prevalence also varies with deprivation, with over one third of people registered with NDH from the two most deprived quintiles
  • there is a higher proportion of people with NDH in the white group compared to minority ethnic groups; 51% compared to 43% respectively. However, BAME groups make up around 30% of the population in Wandsworth. This shows the health inequality of diabetes risk among BAME groups.
NDH Prevalence by Demographic Group, Wandsworth, 2018/19

Type 2 Diabetes Prevalence

Diabetes: QOF prevalence (17+ yrs): In 2022/23, Wandsworth’s rate was 4.7% (n=16044), which was the 7th lowest in London, 37.5% lower than the England average and 32.2% lower than the London average. The latest Borough figure for 2022/23 was also 9.7% higher than in 2012/13, in comparison with 23.9% increase in England’s rate in the equivalent time period.

Source: OHID: Public Health Profiles

Source: OHID: Public Health Profiles

The figure below provides the demographic breakdown of people diagnosed with Type 2 Diabetes. At individual GP practice level, the prevalence of diagnosed diabetes ranges from around 1% to 12%.

Demographic Breakdown of People Diagnosed with Type 2 Diabetes, 2018/19

Source: NHS Digital. National Diabetes Audit. 2018/19

  • Type 2 Diabetes is more common in males than females; 55% are male. While there is little difference in the prevalence of NDH by sex, males have a higher prevalence of diabetes overall compared to females.
  • Just under half of Type 2 registrations are amongst the 40-64 years age group and over one third in the 65-79 years age group.
  • Similar to NDH, over one third of people diagnosed with Type 2 diabetes are from the two most deprived quintiles.
  • Around 35% of people diagnosed with Type 2 diabetes are white, 60% minority ethnic origin, with a further 5% unknown or not stated. As BAME groups make up around 30% of the population in Wandsworth, this reflects the health inequality of diabetes among minority ethnic groups.

Comparing prevalence of NDH to Type 2 diabetes, a higher proportion of males and BAME groups develop Type 2 diabetes.

Prevalence by Ward

There is variation in diabetes prevalence across the Borough. Diabetes is most prevalent in Roehampton and the Furzedown & Tooting cluster (Furzedown East, Furzedown West, Tooting North, Tooting West, Tooting East,). This corresponds with having a higher proportion of older people aged 65+, deprived areas, and BAME groups (Tooting), risk factors for Type 2 Diabetes (the figure below).

Diabetes Prevalence in Wandsworth by LSOA, 2017/18

Source: DataWand This map shows diabetes prevalence across Wandsworth, with darker blue areas indicating higher prevalence.

Around 30% of the Wandsworth population (81,000 residents) are from BAME groups 10. The BAME population is higher in the south and north-east areas of the borough. Tooting has the highest BAME population with over half of its residents from this group, while Thamesfield ward has the greatest proportion of white/white British ethnic group at 88%. Latchmere ward has the greatest proportion of black/black British ethnic group. The BAME group is expected to increase to nearly 40% of the population by 2040.

23% of the Wandsworth population is aged 50 years and over. Higher numbers of those aged 65+ are concentrated in Roehampton/West Putney and St. Mary’s Park (Battersea Park area). There are larger numbers of 70+ and 80+ residents in the Nightingale Lane and Tooting Bec West neighbourhoods. In addition, 21% of older people in the Borough are affected by income deprivation, with 8,874 adults over 60 years living in deprived areas. The most deprived areas of the Borough, in terms of overall deprivation, are Roehampton, West Putney, Latchmere, Queenstown and Tooting.

An estimated 11% of the Wandsworth population has a disability affecting day to day activities 11. People with one or more LTC account for approximately 25% of the population in Wandsworth.

Undiagnosed Diabetes

It is estimated that 22,854 people in Wandsworth have diabetes (all types of Diabetes) 12. This includes people that have already been diagnosed by their GP, and those who have diabetes but do not know it (undiagnosed). Around 60% of people living with diabetes are diagnosed. This is lower than the diagnosis rates for England 78%, and London 71.4%.

Approximately 40% (8749)of people live with undiagnosed diabetes and do not receive vital health monitoring, checks and treatment.

NDH estimates show that 18,650 people have high blood sugar. They are unaware the risk of developing diabetes and miss out on intervention or annual monitoring.

Projected Diabetes Prevalence

Projections for diabetes prevalence up to 2035 show an increase in the number of people living with diabetes in Wandsworth, as well as in London and England at a similar rate. By 2035, it is estimated that 8.2% of people in Wandsworth will have diabetes. This is less than a 1% increase but amounts to a further 5,960 people living with diabetes in Wandsworth over the next 15 years (the figure below). Projected Diabetes Prevalence in Wandsworth. 2020–2035

Source: Prevalence estimates of Diabetes, Public Health England, 2016

Risk of Type 2 Diabetes

The risk factors for being at high risk of type 2 diabetes and developing type 2 diabetes are the same. These factors include:

  • Overweight or obesity - there is a seven times greater risk in people who are obese and three times if overweight
  • High Blood Pressure - people are more at risk if they have ever had high blood pressure
  • Certain ethnicities - People of South Asian origin are six times more likely to develop Diabetes and Black-Caribbean and Black African are three times more likely
  • Age - Risk increases with age. People are more at risk if they are older than 40 or older than 25 if they are Black Caribbean, Black African, or South Asian
  • Family History - People are two to six times more likely to get type 2 diabetes if they have a parent, brother, sister or child with diabetes
  • Smoking - Smoking has been proven to be an independent risk factor for Diabetes, and amongst diabetics it increases the risk of complications. The highest risk is among heavy smokers and risk remains elevated for about 10 years after smoking cessation, reducing more quickly for lighter smokers 13.
  • Deprivation is strongly associated with higher levels of obesity, physical inactivity, unhealthy diet, smoking and poor blood pressure control, all of which are linked to the risk of developing type 2 diabetes. Prevalence of type 2 diabetes is 60% more common among individuals in the most deprived quintile compared with those in the least deprived quintile in England
  • Gestational Diabetes - Gestational Diabetes affects around 5% of all pregnancies 14. Women who have had Gestational Diabetes are at a sevenfold increased risk of developing type 2 diabetes later in life, especially if they gain weight. Children born to mothers with diabetes during pregnancy tend to have a greater BMI, raised fasting glucose levels and an increased risk of developing type 2 diabetes later in life
  • Children born to mothers with diabetes during pregnancy tend to have a greater BMI, raised fasting glucose levels and an increased risk of developing Type 2 Diabetes later in life *People at high risk of Type 2 Diabetes have a greater chance of developing Type 2 Diabetes in the future. One out of four people with high risk will develop Type 2 Diabetes in the next 10 years 15.

Complications

People who develop Type 2 Diabetes are at greater risk of developing complications from the disease including:

  • CVD including heart attack and stroke – Type 2 Diabetes leads to a 2-fold excess risk of CVD. In Wandsworth, people with diabetes are 51.1% more likely to have a heart attack, and 57.9% more likely to have a stroke
  • blindness – a leading cause of preventable slight loss among people of working age
  • nerve damage - most often in legs or feet
  • Kidney Disease and Failure - Diabetes is the leading cause of Kidney Disease
  • diabetic foot disease- a potential consequence of nerve damage and the complication of peripheral vascular disease.
  • foot problems are the most frequent reasons for hospitalisation amongst people who have diabetes. Latest figures for Wandsworth show that between 2016/2017 and 2018/2019, there were 580 hospital spells for Diabetic Foot Disease; this was significantly better than the England average. The median length of stay in hospital was 5.5 days.
  • diabetes is one of the leading causes of amputation of the lower limbs. From 2016/2017- 2018/2019 there were 25 major amputation procedures, above or below the knee (an age and ethnicity standardised rate of 8.0 major amputations per 10,000 population-year).
  • there were 80 minor amputation procedures (removal of toes or feet) with a directly age and ethnicity standardised rate of 22.0 per 10,000 population-year. These were similar to the England averages.

The figure below shows that out of 19,500 Wandsworth’s patients that are expected to have type 2 diabetes, 13,500 (69%) patients have been identified as diabetic and recorded on GP diabetes registers. Only 4,300 have been recorded to meet the 3 diabetes treatment targets for blood sugar level, blood pressure and cholesterol (22% of the estimated population of people with diabetes).

Type 2 Diabetes Detection Rates and Treatment Targets Compliance in Wandsworth, 2019

Source: SWL CCG, 2021 from QOF data and ONS estimates of type 2 diabetes prevalence for Wandsworth.

Current Services

A range of services are available for people at high risk of developing or being Type 2 diagnosed with Type 2 Diabetes. The services offer support to people to help prevent Type 2 Diabetes, as well as to diagnose people with diabetes early, ensuring quality of care and effective management.

Primary Care

Much of the management and monitoring of patients at risk of and with Type 2 Diabetes is undertaken by GPs and members of the Primary Care Team through:

  • blood tests
  • registers of patients with Type 2 Diabetes and those at high risk
  • annual recall assessments
  • advice and signposting by GPs and practice nurses
  • medication (metformin, insulin)
  • blood sugar checks (HbA1c) every three months when newly diagnosed, and every 6 months once stable
  • annual diabetic review (eight care processes recommended by NICE)
  • the five risk factors include body mass index, blood pressure, smoking, glucose levels (Hba1c) and cholesterol
  • four tests to identify early complications include urine albumin creatinine ratio, serum creatinine, foot nerve and circulation examination.

These important markers ensure diabetes is well controlled and prevent long-term complications.

Healthier You: NHS Diabetes Prevention Programme (NDPP)

The NDPP is an intensive lifestyle support programme for people identified as high risk for developing Type 2 Diabetes. Individuals are eligible if they are identified by their GP with NDH, defined as having an HbA1c 42 – 47 mmol/mol (6.0 – 6.4%), or a fasting plasma glucose (FPG) of 5.5 – 6.9 mmol/l. The service offers tailored, personalised support to reduce the risk of Type 2 Diabetes. This includes education on healthy eating and lifestyle, help to lose weight and physical exercise programmes. Local group sessions are delivered in community settings, and a digital option is offered to those declining face-face group sessions.

The table below shows the outcomes of the service.

NDDP Outcomes, Wandsworth, 2018–2020

Source: NDDP programme

Of the people who attended the NDPP Service in Wandsworth:

  • 58% male
  • 42% Female
  • 73% were aged less than 70
  • 53% were of Asian, Black, mixed or another ethnicity
  • 30% were from the two most deprived quintiles
  • 16% were of normal weight (BMI 18–24.9), 33% overweight (BMI 25–29.9), and 30% obese (BMI >30).

Early outcomes of the service across England demonstrate that those completing the programme had a mean weight loss of 3.3 kg and an HbA1c reduction of 2.04 mmol/mol 16.

Structured Education Programmes

Good management of diabetes reduces risk and serious complications. However, most people do not receive structured education, or care processes recommended by NICE. Structured Education uptake is low. In 2017, there was 15.8% attendance of patients newly diagnosed with Type 2 Diabetes over the first 12 months.

Structured Education Programmes can help adults with Type 2 Diabetes to improve their knowledge and skills and help to motivate them to take control of their condition and self-manage it effectively. A range of Diabetes Education Programmes exist in London, such as DESMOND and X-PERT. Remote courses such as Oviva are also available for those who prefer digital support.

Alongside GPs, practice nurses and healthcare professional’s referrals, people are now able to self-refer. The Diabetes Book & Learn Website allows people to book courses across London using online booking.

The table below provides an overview of referrals to Structured Education in 2017 17.

Referrals to Structured Education, 2017

Source: NHS Digital, National Diabetes Audit (NDA) 2018-19 Interactive report for England, Clinical Commissioning Groups and GP practices, 13 December 2019.

The table below provides an overview of referrals to Diabetes Book & Learn from October 2018-January 2020 for people with Type 2 Diabetes. However, these are approximate figures due to issues with recording of attendance by providers on the Diabetes Book & Learn Website.

Referrals to the Diabetes Book and Learn Website, 2018–2020

Source: NHS Digital, National Diabetes Audit (NDA) 2018/19 Interactive report for England, Clinical Commissioning Groups and GP practices, 13 December 2019.

Treatment Targets

NICE recommends treatment targets for Hba1c (glucose control), blood pressure and serum cholesterol:

  • measuring and managing Hba1c helps reduce the risk of all diabetic complications
  • managing high blood pressure can reduce the risk of vascular complications and the progression of eye disease and kidney failure
  • reducing cholesterol can reduce the risk of vascular complications. Meeting all three treatment targets’ is achieved where a patient has HbA1c ≤58mmol/mol, cholesterol <5mmol/L and blood pressure ≤140/80.

Around 60% of people with Type 2 Diabetes have not achieved all three treatment targets (for blood glucose, blood pressure, cholesterol). The table below shows that in comparison with similar CCGs, the Sustainability and Transformation Plan (STP) and England, Wandsworth is performing similarly to CCGs and England, but slightly lower than the STP.

There was a variation in the achievement between GP Practices, ranging from 25%–60%.

Source: National Diabetes Audit (NDA) 2018/19

Data Limitations

The estimated NDH prevalence is based on modelled data. PHOF states “with all modelled data, there is a degree of uncertainty associated with these estimates therefore should be considered indicative only.” Additionally, ward level or LSOA breakdown of the data is not available for both data sets.

Like the estimated NDH prevalence data, diabetes prevalence is based on modelled data and does not include confidence intervals. The data has not been interpreted beyond borough level. This data includes Type 1 Diabetes and does not make a distinction between the types of diabetes.

2.3 Hypertension

GP Recorded Hypertension Prevalence

Early diagnosis and treating hypertension significantly reduces the risk of CVD.

Hypertension: QOF prevalence (all ages): In 2022/23, Wandsworth’s rate was 8.6% (n=35319), which was the 5th lowest in London, 40.3% lower than the England average and 21.2% lower than the London average. The latest Borough figure for 2022/23 was also 0.2% higher than in 2012/13, in comparison with 5.5% increase in England’s rate in the equivalent time period.

Source: OHID: Public Health Profiles

Source: OHID: Public Health Profiles

2.4 Coronary Heart Disease (CHD)

GP Recorded CHD Prevalence

CHD: QOF prevalence (all ages): In 2022/23, Wandsworth’s rate was 1.4% (n=5693), which was the 5th lowest in London, 53.5% lower than the England average and 25.4% lower than the London average. The latest Borough figure for 2022/23 was also 6.9% lower than in 2012/13, in comparison with 10.6% decrease in England’s rate in the equivalent time period.

Source: OHID: Public Health Profiles

Source: OHID: Public Health Profiles

CHD Admissions

Hospital admissions due to coronary heart disease: In 2022/23, Wandsworth’s rate was 374.1 per 100,000 (n=725), which was the 11th lowest in London, 3.4% lower than the England average and 0.0% higher than the London average. The latest Borough figure for 2022/23 was also 54.9% lower than in 2003/04, in comparison with 46.2% decrease in England’s rate in the equivalent time period.

Source: OHID: Public Health Profiles

Source: OHID: Public Health Profiles

2.5 Stroke

GP Recorded Prevalence of Stroke

Stroke: QOF prevalence (all ages): In 2022/23, Wandsworth’s rate was 0.9% (n=3678), which was the 6th lowest in London, 51.5% lower than the England average and 18.6% lower than the London average. The latest Borough figure for 2022/23 was also 14.0% higher than in 2012/13, in comparison with 8.7% increase in England’s rate in the equivalent time period.

Source: OHID: Public Health Profiles

Source: OHID: Public Health Profiles

Stroke Admissions

Hospital admissions due to stroke: In 2022/23, Wandsworth’s rate was 165.5 per 100,000 (n=315), which was the 8th lowest in London, 1.7% lower than the England average and 0.0% higher than the London average. The latest Borough figure for 2022/23 was also 0.7% higher than in 2003/04, in comparison with 6.8% decrease in England’s rate in the equivalent time period.

Source: OHID: Public Health Profiles

Source: OHID: Public Health Profiles

Stroke Mortality

Mortality rate from stroke, all ages: In 2020 - 22, Wandsworth’s rate was 41.7 per 100,000 (n=215), which was the 10th lowest in London, 17.1% lower than the England average and 9.9% lower than the London average. The latest Borough figure for 2020 - 22 was also 61.8% lower than in 2001 - 03, in comparison with 58.6% decrease in England’s rate in the equivalent time period.

Source: OHID: Public Health Profiles

Source: OHID: Public Health Profiles

3. Cancer

Cancer is a group of diseases involving abnormal cell growth with the potential to invade or spread to other parts of the body. These contrast with benign tumours, which do not spread. This section presents cancer prevalence (including new diagnoses), hospitalisations and cancer survival rates of Wandsworth’s patients.

3.1 Cancer Diagnosed at Early Stages

Percentage of cancers diagnosed at stages 1 and 2: In 2018, Wandsworth’s rate was 60.8% (n=467), which was the highest in London, 11.4% higher than the England average and 8.8% higher than the London average. The latest Borough figure for 2018 was also 7.3% higher than in 2013, in comparison with 0.5% decrease in England’s rate in the equivalent time period.

Source: OHID: Public Health Profiles

Source: OHID: Public Health Profiles

3.2 Cancer Mortality

Premature and preventable cancer mortality can be found in People JSNA Chapter. This section presents mortality from main cancer types including lung, breast and colorectal. There are no mortality indicators for prostate cancer that can be reported. However, the 2012/16 Wandsworth’s incidence ratio for prostate cancer was 110.8 (n=695), the 13th highest rate in London, and higher than the England average.

Mortality rate from lung cancer, all ages: In 2020 - 22, Wandsworth’s rate was 41.2 per 100,000 (n=220), which was the 13th lowest in London, 15.7% lower than the England average and 4.8% lower than the London average. The latest Borough figure for 2020 - 22 was also 43.7% lower than in 2001 - 03, in comparison with 24.9% decrease in England’s rate in the equivalent time period.

Source: OHID: Public Health Profiles

Source: OHID: Public Health Profiles

Mortality rate from colorectal cancer, all ages: In 2020 - 22, Wandsworth’s rate was 21.9 per 100,000 (n=118), which was the 13th lowest in London, 14.9% lower than the England average and 4.6% lower than the London average. The latest Borough figure for 2020 - 22 was also 22.8% lower than in 2001 - 03, in comparison with 18.8% decrease in England’s rate in the equivalent time period.

Source: OHID: Public Health Profiles

Source: OHID: Public Health Profiles

Mortality rate from breast cancer, all ages (Female): In 2020 - 22, Wandsworth’s rate was 21.4 per 100,000 (n=70), which was the lowest in London, 31.5% lower than the England average and 30.2% lower than the London average. The latest Borough figure for 2020 - 22 was also 49.1% lower than in 2001 - 03, in comparison with 30.7% decrease in England’s rate in the equivalent time period.

Source: OHID: Public Health Profiles

Source: OHID: Public Health Profiles

4. Respiratory Diseases

Respiratory diseases include asthma, chronic obstructive pulmonary disease (COPD), pulmonary fibrosis and pneumonia. In this section the latest available Wandsworth-level information on prevalence, hospitalisations and mortality linked to respiratory conditions will be explored. Most of the data presented are published for the registered CCG population (patients registered with Wandsworth’s GP). In 2019/20 five South West London (SWL) CCGs merged into a single South West London CCG which makes it difficult to distinguish information specific to Wandsworth. For most CCG indicators the data presented in the chapter is two years old, as the latest 2019/20 and 2020/21 data is only available at SWL CCG level.

4.1 COPD

COPD (chronic obstructive pulmonary disease) is a diagnostic term that captures a variety of serious lung conditions including chronic bronchitis and emphysema. COPD is usually prevalent in adults over the age of 35 years. COPD is a serious lung disease for which smoking is the biggest preventable risk factor.

GP Recorded Prevalence of COPD

COPD: QOF prevalence (all ages): In 2022/23, Wandsworth’s rate was 0.8% (n=3405), which was the 7th lowest in London, 55.0% lower than the England average and 18.7% lower than the London average. The latest Borough figure for 2022/23 was also 7.9% lower than in 2012/13, in comparison with 6.0% increase in England’s rate in the equivalent time period.

Source: OHID: Public Health Profiles

Source: OHID: Public Health Profiles

Emergency Hospital Admissions for COPD

Emergency hospital admissions for COPD (35+): In 2019/20, Wandsworth’s rate was 401.6 per 100,000 (n=415), which was the 11th highest in London, 3.3% lower than the England average and 12.3% higher than the London average. The latest Borough figure for 2019/20 was also 18.3% lower than in 2010/11, in comparison with 1.3% increase in England’s rate in the equivalent time period.

Source: OHID: Public Health Profiles

Source: OHID: Public Health Profiles

4.2 Asthma

Asthma Recorded Prevalence

Asthma: QOF prevalence (6+ yrs): In 2022/23, Wandsworth’s rate was 4.4% (n=16928), which was the 6th lowest in London, 33.0% lower than the England average and 7.6% lower than the London average. The latest Borough figure for 2022/23 was also 3.8% higher than in 2020/21, in comparison with 2.3% increase in England’s rate in the equivalent time period.

Source: OHID: Public Health Profiles

Source: OHID: Public Health Profiles

5. Mental Health

People living with mental health problem are more likely to make unhealthy lifestyle choices and twice as likely to smoke . Mental health problems often lead to alcohol and substance misuse ; increasing the risk of obesity, asthma, diabetes, chronic obstructive pulmonary disease (COPD) and cardiovascular disease . This section provides an overview of nationally available data on mental health in adults living in Wandsworth. This includes GP recorded prevalence of mental illnesses, referral rates to specialist services, admissions to hospital, employment rates, accommodation status, and premature mortality rates in adults with mental health problems.

5.1 Key Demographics and Need

GP Recorded Prevalence of Mental Illness

GP Mental Health Registers include patients with a diagnosis of schizophrenia, bipolar affective disorder and other psychoses.

Mental Health: QOF prevalence (all ages): In 2022/23, Wandsworth’s rate was 1.0% (n=4215), which was the 13th lowest in London, 3.0% higher than the England average and 9.8% lower than the London average. The latest Borough figure for 2022/23 was also 11.1% higher than in 2012/13, in comparison with 18.6% increase in England’s rate in the equivalent time period.

Source: OHID: Public Health Profiles

Source: OHID: Public Health Profiles

Estimated Prevalence of Common Mental Disorders

Estimated prevalence of common mental disorders: % of population aged 16 & over: In 2017, Wandsworth’s rate was 18.8% (n=49805), which was the 16th lowest in London, 11.0% higher than the England average and 2.5% lower than the London average. Time series data were not available for this indicator.

Source: OHID: Public Health Profiles

5.2 Social Factors

Employment of Mental Health Service Users

Gap in the employment rate for those who are in contact with secondary mental health services and the overall employment rate: In 2021/22, Wandsworth’s rate was 76.9 percentage points, which was the 4th highest in London, 10.8% higher than the England average and 8.0% higher than the London average. Time series data were not available for this indicator.

Source: OHID: Public Health Profiles

Mental Health Service Users Living In Stable Accomodation

Adults in contact with secondary mental health services who live in stable and appropriate accommodation: In 2020/21, Wandsworth’s rate was 77.0%, which was the 9th highest in London, 32.8% higher than the England average and 26.2% higher than the London average. The latest Borough figure for 2020/21 was also 4.7% lower than in 2011/12, in comparison with 6.2% increase in England’s rate in the equivalent time period.

Source: OHID: Public Health Profiles

Source: OHID: Public Health Profiles

5.3 Hospital Admissions for Mental Health Conditions

Hospital admissions for mental health conditions: In 2022/23, Wandsworth’s rate was 68.3 per 100,000 (n=40), which was the 14th highest in London, 15.5% lower than the England average and 10.7% higher than the London average. The latest Borough figure for 2022/23 was also 6.8% higher than in 2010/11, in comparison with 12.3% decrease in England’s rate in the equivalent time period.

Source: OHID: Public Health Profiles

Source: OHID: Public Health Profiles

5.4 Premature Mortality in Adults with Severe Mental Illness (SMI)

Premature mortality in adults with severe mental illness (SMI): In 2020 - 22, Wandsworth’s rate was 99.2 per 100,000 (n=455), which was the 10th lowest in London, 10.8% lower than the England average and 10.1% lower than the London average. The latest Borough figure for 2020 - 22 was also 20.8% higher than in 2015 - 17, in comparison with 22.6% increase in England’s rate in the equivalent time period.

Source: OHID: Public Health Profiles

Source: OHID: Public Health Profiles

6. Sexual Health

6.1 Sexually Transmitted Infections

Sexual health is an important public health issue with health, social and economic impacts that can affect the people across the life course. It is a fundamental aspect of human identity and life experience. Wandsworth uses the World Health Organisation’s definition of sexual health:

“A state of physical, mental and social well-being in relation to sexuality. It requires a positive and respectful approach to sexuality and sexual relationships, as well as the possibility of having pleasurable and safe sexual experiences, free of coercion, discrimination and violence.” 18

Poor sexual health can lead to sexually transmitted infections (STIs), HIV and unintended pregnancies which can lead to further long-lasting and costly impacts for both individuals and wider society. However, they can be reduced through safer sex practices such as the use of condoms, regular testing, and access to sexual health and reproductive services 19. Sexual health services currently focus on treatment for sexual health transmitted infections, HIV, unplanned pregnancies, and prevention.

In 2018, there were 447,694 diagnoses of sexually transmitted infections (STIs), an increase of 5% since 2017. National increases have been seen across the spectrum of different STIs. However, in 2018 gonorrhoea had the highest STI diagnoses (56,000) representing a 26% increase since 2017. This is most concerning as cases of drug resistant strains of gonorrhoea have also been identified. The UK has also seen an increase of syphilis (5%) since 2017.

Further detail regarding sexual health profiles in Wandsworth can be found in our comprehensive Sexual Health Needs Assessment and corresponding Strategy and Action Plan published in 2019.

All new STI diagnoses rate per 100,000: In 2023, Wandsworth’s rate was 2040.2 per 100,000 (n=6713), which was the 10th highest in London, 190.0% higher than the England average and 40.9% higher than the London average. The latest Borough figure for 2023 was also 10.5% higher than in 2012, in comparison with 16.6% decrease in England’s rate in the equivalent time period.

Source: OHID: Public Health Profiles

Source: OHID: Public Health Profiles

Key Findings from Wandsworth Sexual Health Needs Assessment, 2018 (STIs):

  • the 2018 STI diagnosis rate for England was784/100,000 population, and higher in Wandsworth at 1976/100,000 population
  • newly diagnosed STIs (excluding chlamydia aged <25) at 2195/100,000 population is significantly higher than both England at 851/100,000 population and London at 936/100,000
  • trends have stabilised since 2012
  • diagnostic rates of gonorrhoea is 328.5/100,000 population, with recent trends showing a slow increase in diagnosis which is higher than the London average of 279.4
  • London is currently witnessing an increase in the rate of Syphilis. In Wandsworth in 2018, the syphilis diagnostic rate was at 54.8/100,000 population which is higher than the other London boroughs and significantly higher than the rest of England
  • an HIV prevalence rate of 5.49/1000 people aged 15–59 years, Wandsworth is now classed as an ‘extremely high’ prevalence area for HIV in accordance with NICE guidance
  • a larger proportion of white gay/lesbian are newly diagnosed with STIs
  • the 2018 chlamydia infection rate represents a 16% increase from the previous year (3,063/100,000 population).
  • on-line screening activity is beginning to grow, rising to 439 by the end of quarter two, with positivity increasing from 4.9% to 6.2%. This provides good evidence to suggest that the channel shift form clinic to e-services is starting to take hold.
  • national and local evidence clearly demonstrates that sexual health need varies according to factors such as age, gender, sexuality and ethnicity with inequalities in sexual health disproportionately affecting Black & Asian, Minority Ethnic (BAME) communities, those identifying as LGBTQ+, men who have sex with men (MSM).

MSM are among the largest groups diagnosed with a new STI diagnosis. BAME communities in Wandsworth also experience a significantly higher proportion of STI infection compared to the proportion of the population from other ethnic groups. Moreover, with an HIV prevalence rate of 5.49/1000 people aged 15–59 years, Wandsworth is classed as an ‘extremely high’ prevalence area for HIV in accordance to NICE guidance. This compares with an England rate of 2.4/1000, and 5.7/1000 across London. While this rate has remained stable over the last 5 years universal testing is recommended for high prevalence areas 20. National analysis shows that two-thirds of late HIV diagnoses occur in high-and extremely-high-prevalence local authorities . More intensive testing is recommended in areas exceeding the 5/1000 threshold.

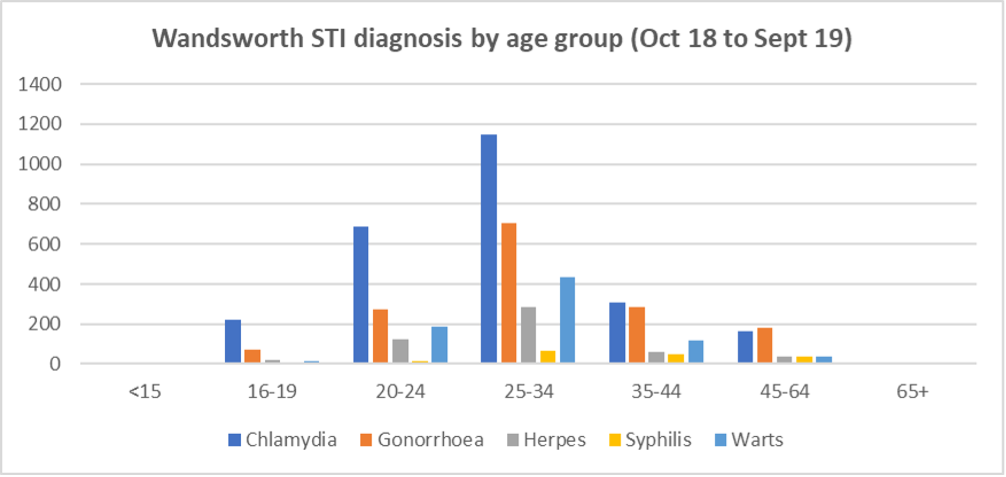
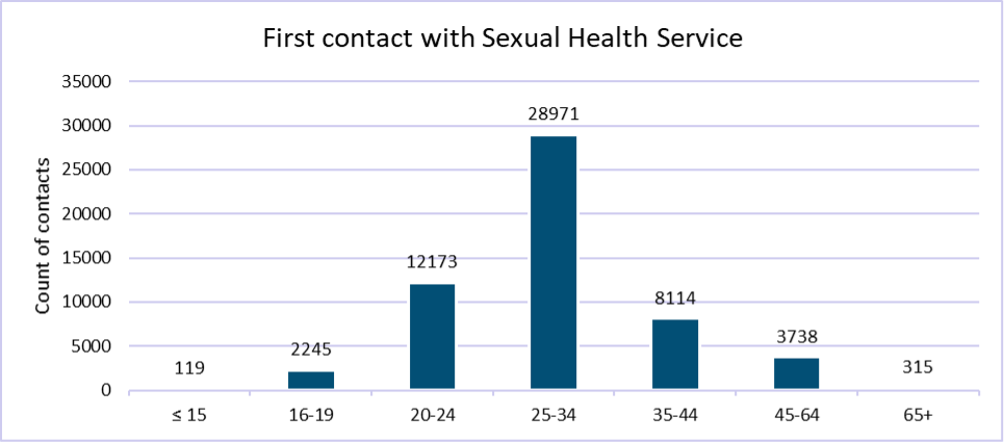
Age and Gender Distribution of New STI Diagnoses

The age and gender distribution of new STI diagnoses (chlamydia, gonorrhoea, herpes, syphilis, warts) in Wandsworth residents in 2018 highlights that the largest number of newly diagnosed STI’s are in the 25 to 34-year-old age cohort (figure below).

STI diagnoses by age group in Wandsworth, 2018/19 Source: GUMCAD Extracted Feb 2020

Sexual Orientation

People identifying as LGBTQ+ can experience a greater degree of health inequalities, including sexual health 21. National data shows where gender and sexual orientation are known. MSM account for 29% of London residents diagnosed with a new STI in a specialist health clinic. 90% have syphilis and 63% have gonorrhoea. In line with the national picture, the amount of diagnoses of gonorrhoea and syphilis are higher in gay men compared to heterosexual men (figure below).

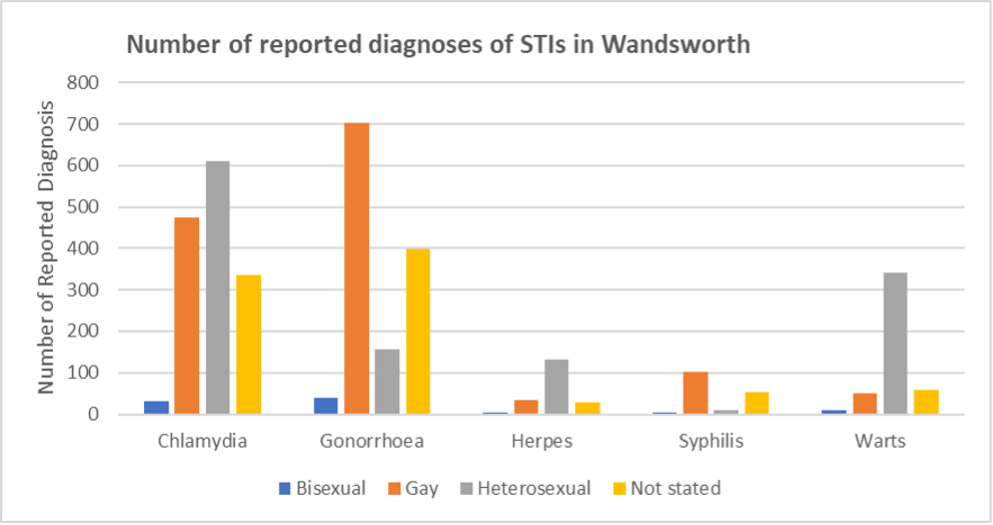
Count of STI diagnoses in Wandsworth by sexual orientation

Source: GUMCAD Sep ’18–Oct ’19

When comparing new diagnosis of STIs by ethnic origin and sexual orientation a larger proportion of white gay/lesbian are newly diagnosed.

New STI Diagnoses (Excluding Chlamydia) in People Aged Under 25 Years

New STI diagnoses (excluding chlamydia aged under 25) per 100,000: In 2023, Wandsworth’s rate was 1745.7 per 100,000 (n=5744), which was the 10th highest in London, 235.8% higher than the England average and 42.1% higher than the London average. The latest Borough figure for 2023 was also 15.5% higher than in 2012, in comparison with 8.5% decrease in England’s rate in the equivalent time period.

Source: OHID: Public Health Profiles

Source: OHID: Public Health Profiles

Genital chlamydia trachomatis is the most commonly reported bacterial STI in England. Infection is asymptomatic in at least 70% of women and 50% of men. As a result, most infections remain undiagnosed 22.

Untreated chlamydia infection has significant health consequences. It is associated with considerable health risks in women of reproductive age, including pelvic inflammatory disease, ectopic pregnancy and infertility. In men, complications can include urethritis, epididymitis and Reiter’ Syndrome. The chlamydia detection rate is one of the Health Protection, part the Public Health Outcomes Framework (PHOF). In 2013 the department of Health set a recommended chlamydia detection rate of ≥2300 per 100.000 population requiring high volumes of screening and diagnosis.

Gonorrhoea Diagnostic Rate

Gonorrhoea diagnostic rate per 100,000: In 2023, Wandsworth’s rate was 540.1 per 100,000 (n=1777), which was the 11th highest in London, 261.9% higher than the England average and 35.9% higher than the London average. The latest Borough figure for 2023 was also 172.0% higher than in 2012, in comparison with 196.9% increase in England’s rate in the equivalent time period.

Source: OHID: Public Health Profiles

Source: OHID: Public Health Profiles

Syphilis Diagnostic Rate

Syphilis diagnostic rate per 100,000: In 2023, Wandsworth’s rate was 52.0 per 100,000 (n=171), which was the 12th highest in London, 212.0% higher than the England average and 4.8% higher than the London average. The latest Borough figure for 2023 was also 184.7% higher than in 2012, in comparison with 195.7% increase in England’s rate in the equivalent time period.

Source: OHID: Public Health Profiles

Source: OHID: Public Health Profiles

HIV Prevalence

HIV diagnosed prevalence rate per 1,000 aged 15 to 59: In 2022, Wandsworth’s rate was 4.9 per 1,000 (n=1139), which was the 16th highest in London, 108.4% higher than the England average and 7.6% lower than the London average. The latest Borough figure for 2022 was also 2.6% higher than in 2011, in comparison with 19.1% increase in England’s rate in the equivalent time period.

Source: OHID: Public Health Profiles

Source: OHID: Public Health Profiles

The rate of new HIV diagnosis per 100,000 population among people aged 15 years and above was 25.9% compared to 20.9% across London, and 8.7% in England. This year, 70 adult residents were newly diagnosed with HIV. Since 2015, Wandsworth has seen a 34.4% decrease in new HIV diagnoses. The decrease implies the success of a combination HIV prevention which includes condom provision, pre-exposure prophylaxis (PrEP), expanded HIV testing, and prompt initiation of treatment after diagnosis.

In Wandsworth the E-Service during this period had HIV detection rates for over 24 year olds of non-reactive 7,018 (99.7%) and reactive 21 (0.3%) while the numbers of postal test kits sent out by the newly commissioned SH:24 service totalled 26 with 11 being processed. Most of these kits were requested by people in the 25-34 age group (48.39%) and by males (64.34%). 2 reactive results were produced from those kits processed.

The vast majority (79.6%) of newly diagnosed patients with HIV in the borough were put on Antiretroviral treatment (ART) within 91 days of their diagnosis. Successful ART decreases a person’s viral load, significantly reduces the risk of future transmission and transforms HIV from a fatal infection to a chronic but manageable condition. However, between 2016 and 2018, 34.5% HIV diagnoses were made at a late stage of infection (CD4 count =<350 cells/mm 3). Late diagnosis is the most important predictor of HIV-related morbidity and short-term mortality and is a key component of valuating the success of HIV testing efforts.

Contact with Sexual Health Services

In addition to accessing services at the local Integrated Sexual Health, ISH service, borough residents can also choose to access sexual health service anywhere in the country. Latest available service data shows that there has been good and improving access to the variety of sexual health services offered across the borough. In Wandsworth from October 2018 to September 2019 over 55,500 people accessed a sexual health service for the first time (figure below). Access was greater amongst females who represented 59% of attendees 23.

Count of contacts with Wandsworth’s sexual health service by age group

Source: GUMCAD Extracted Feb 2020

7. Obesity

7.1 Prevalence

Overweight (including obesity) prevalence in adults: In 2022/23, Wandsworth’s rate was 49.5%, which was the 5th lowest in London, 22.6% lower than the England average and 13.4% lower than the London average. The latest Borough figure for 2022/23 was also 6.3% lower than in 2015/16, in comparison with 4.4% increase in England’s rate in the equivalent time period.

Source: OHID: Public Health Profiles

Source: OHID: Public Health Profiles

7.2 Obesity in Early Pregnancy

Obesity in early pregnancy: In 2018/19, Wandsworth’s rate was 10.8%, which was the 5th lowest in London, 51.2% lower than the England average and 39.4% lower than the London average. Time series data were not available for this indicator.

Source: OHID: Public Health Profiles

Acronyms


  1. QOF 2019↩︎

  2. LSOAs ranked amongst the 50% most deprived nationally (deprivation deciles 1 – 5) on the Index of Multiple Deprivation 2019.↩︎

  3. 2019-20 Wandsworth NHS Health Checks data, Public Health Primary Care Team.↩︎

  4. Public Health England, NHS Health Check Best practice guidance, March 2016.↩︎

  5. Public Health England, Emerging evidence on the NHS Health Check: findings and recommendations, 2017.↩︎

  6. Source: 2019-20 Wandsworth NHS Health Checks data, Public Health Primary Care Team↩︎

  7. Diabetes UK, Us, Diabetes and a lot of facts and stats. 2019↩︎

  8. Diabetes UK, Us, Diabetes and a lot of facts and stats. 2019↩︎

  9. Source: NHS Digital. National Diabetes Audit. 2018/19. URL: https://digital.nhs.uk/data-and-information/clinical-audits-and-registries/national-diabetes-audit↩︎

  10. London Datastore, Ethnic Groups by Borough, 2011-2018. Data used:2018↩︎

  11. Office of National Statistics, 2011 census↩︎

  12. Public Health England, Public Health Profiles, Estimated Prevalence of Diabetes (undiagnosed and diagnosed)↩︎

  13. World Health Organization, Global Report on Diabetes, 2016.↩︎

  14. NICE, Diabetes in pregnancy: management from preconception to the postnatal period, last updated August 2015.↩︎

  15. Diabetes UK.↩︎

  16. Valabhji J , Barron E, BradleyD et al. Early Outcomes From the English National Health Service Diabetes Prevention Programme. Diabetes Care Jan 2020, 43 (1) 152-160; DOI: 10.2337/dc19-1425↩︎

  17. NHS Digital, National Diabetes Audit (NDA) 2018-19 Interactive report for England, Clinical Commissioning Groups and GP practices, 13 December 2019.↩︎

  18. WHO (2006) Defining sexual health: Report of a technical consultation on sexual health, 28-31 January 2002, Geneva↩︎

  19. Department of Health (2001) The national strategy for sexual health and HIV.↩︎

  20. NICE guideline [NG60] (2016) HIV testing: increasing uptake among people who may have undiagnosed HIV.↩︎

  21. Government Equalities Office (2018) LGBT Action plan 2018 – improving the lives of lesbian, gay, bisexual and transgender people.↩︎

  22. Stamm W.E. Chlamydia trachomitis: progress and problems. Journal of Infectious Diseases. 1999; 179:S380-3.↩︎

  23. GUMCAD (accessed Feb 2020), Wandsworth Patients attending all GUM and non-GUM services (Oct 18-Sept 19)↩︎